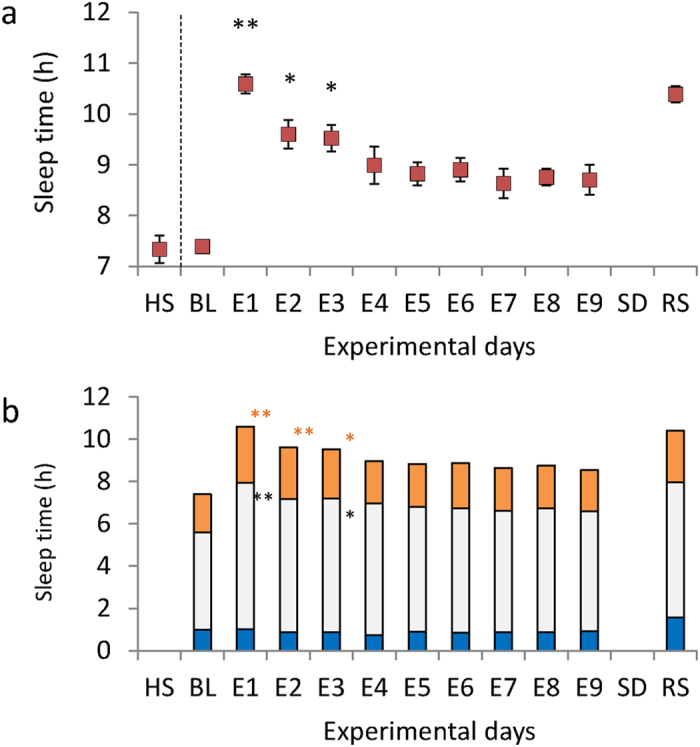
Figure 1. Total sleep time (TST) and sleep structure during the sleep protocol.

(a) TST as determined by polysomnography (PSG) on each experimental night. BL: baseline night; E1–E9: extended sleep sessions on days 1–9; SD: sleep deprivation night; RS: recovery sleep night. Habitual sleep (HS) is the total sleep time calculated from at-home actigraphy. Data are expressed as means with error bars representing the standard error of the mean. **p < 0.01, *p < 0.05. Mixed model analysis of variance for repeated measures showed significant differences in TST within extended sleep sessions (F (8,109.107) = 10.590, p < 0.001; HS, BL, and RS not included in the analysis). Multiple comparisons showed TST was significantly longer at E1, E2, and E3 compared to E9. (b) Sleep structure determined by PSG on each experimental night. Blue filled bar: slow wave sleep; Grey filled bar: sleep stages 1 + 2 (st1 + 2); Yellow filled bar: REM sleep (stREM). **p < 0.01, *p < 0.05. During extended sleep sessions, the total amount of sleep showed significant differences in st1 + 2 and stREM, but not sleep stages 3 + 4 (st3 + 4) (st1 + 2, F(8,110.012) = 5.973, p < 0.001; stREM, F(8,110.164) = 8.003, p < 0.001; st3 + 4: F(8,109.970) = 1.342, p = 0.230). Multiple comparisons showed E1 and E3 had longer st1 + 2 and stREM than E9, and E2 showed longer stREM than E9.
