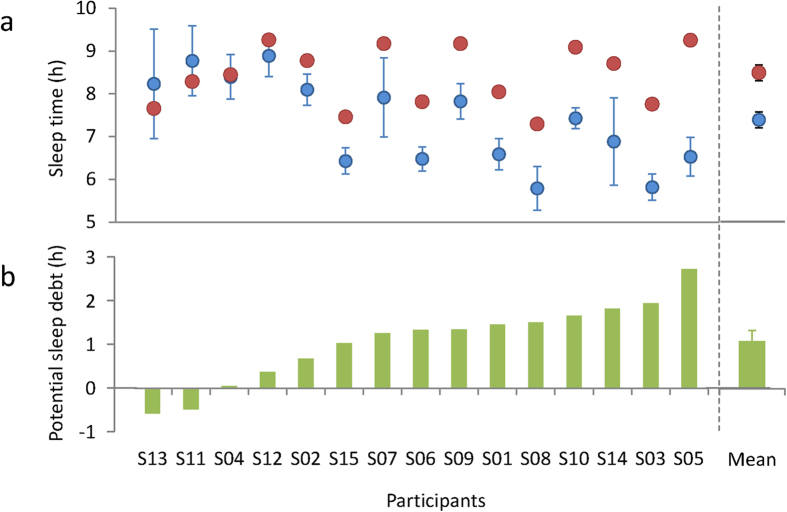
Figure 2. Habitual sleep duration (HSD), optimal sleep duration (OSD), and potential sleep debt (PSD) for each individual.
(a) Mean and individual’s OSD and HSD. Individual data are presented in ascending order of PSD. Red filled circles: OSD, Blue filled circles: HSD. (b) Mean and individual’s PSD (HSD subtracted from OSD). Mean HSD was significantly shorter than mean OSD by approximately 1 h (t(14) = 4.547, p < 0.001).

