Fig. 1.

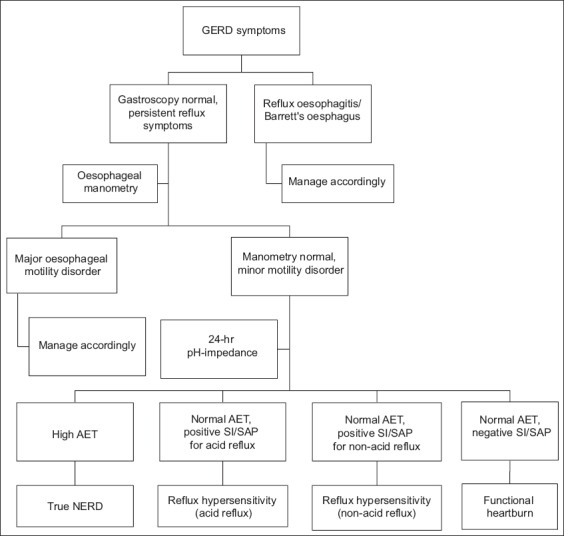
Flow chart shows stratification of patients evaluated for persistent gastro-oesophageal reflux disease (GERD) symptoms. AET: acid exposure time; NERD: non-erosive reflux disease; SAP: symptom association probability; SI: symptom index

Flow chart shows stratification of patients evaluated for persistent gastro-oesophageal reflux disease (GERD) symptoms. AET: acid exposure time; NERD: non-erosive reflux disease; SAP: symptom association probability; SI: symptom index