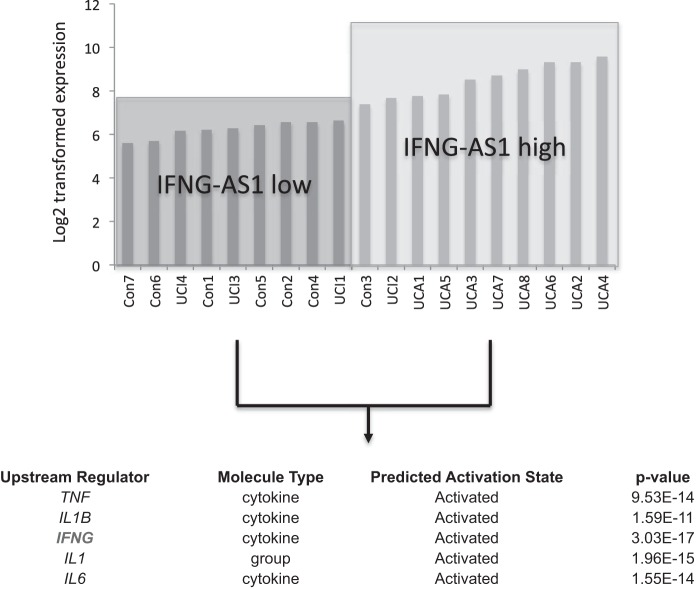
Fig. 5.
Expression of IFNG-AS1 based on microarray expression across all UC and control samples. Two groups were created showing relative high and low levels of IFNG-AS1. Bioinformatic analysis was performed on the associated coding transcript expression changes between the two groups. A list of upstream regulators found to be activated in the IFNG-AS1 high group are listed along with the predicated activation state and the associated P value.

