Fig. 6.
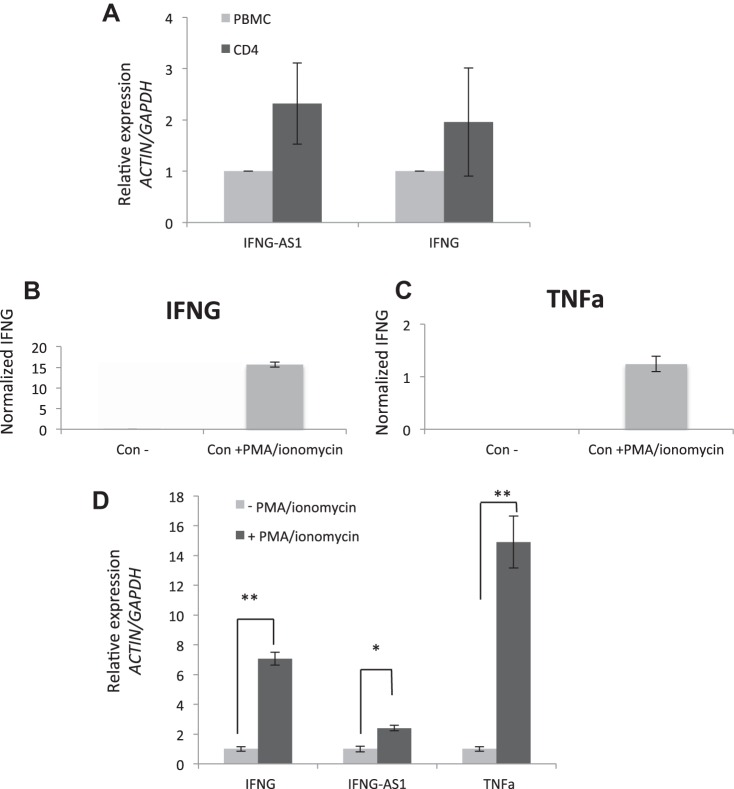
A: qPCR expression of IFNG-AS1 and IFGN among CD4 cells and total PBMC (N = 4). B and C: Jurkat T cells activated with PMA/ionomycin for 6 h and cultured media collected after 24 h show inductions of IFNG and TNF-α protein, respectively. D: Jurkat T cells activated with PMA/ionomycin for 6 h; qPCR analysis of IFNG, IFNG-AS1, and TNF-α. *P value < 0.05, **P value < 0.01; n = 3.

