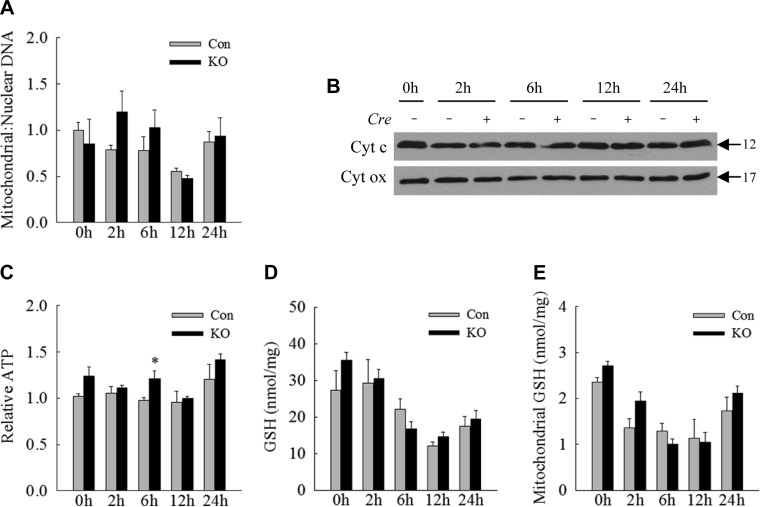
Fig. 4.
Mitochondrial accumulation and dysfunction do not occur in knockout (KO) mice. A: ratios of mitochondrial to nuclear DNA in the livers of control (Con) and Atg7Δhep KO mice untreated and LPS-treated for the indicated number of hours. B: immunoblots of total liver protein from individual Con (Cre −) and KO (Cre +) mice probed for the mitochondrial proteins cytochrome c (Cyt c) and cytochrome oxidase (Cyt ox). C: relative levels of ATP in the livers. D: whole liver GSH levels. E: mitochondrial GSH levels. Values are means ± SE; n = 3–6. *P < 0.05, compared with Con mice at the same time point.

