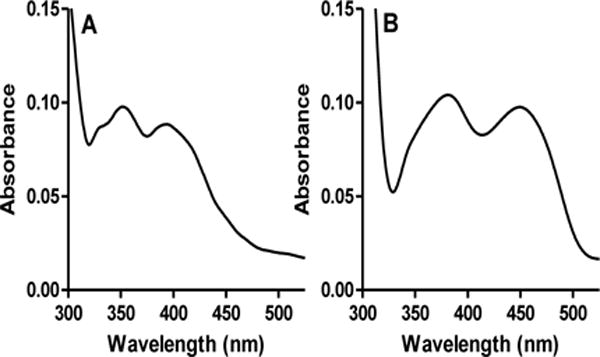
Figure 2.

Visible absorption spectra of the two protein fractions that eluted from the Ni-NTA affinity column. A. Absorption spectrum of the active fraction which exhibits a spectrum characteristic of CTQ. B. Absorption spectrum of the inactive fraction which exhibits a spectrum characteristic of flavin.
