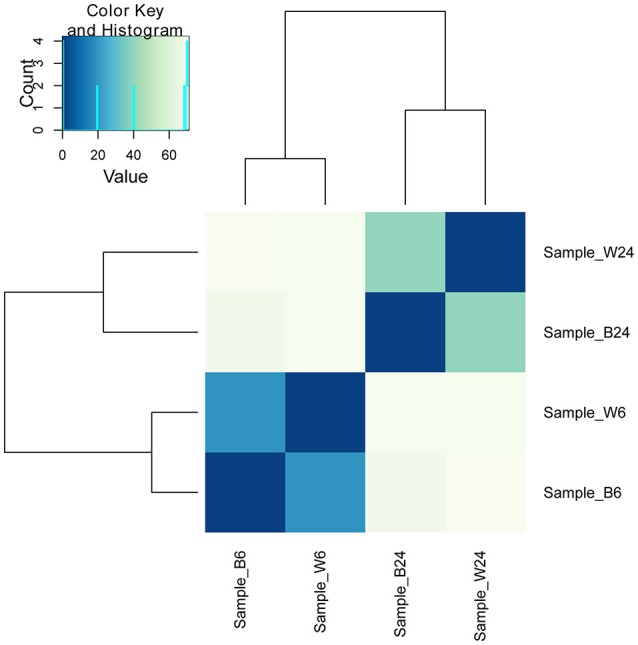
Figure 4.

Clustering of 4 RNA-seq samples. Sample_W6, USA500 grown to 6 h; Sample_B6, USA500ΔctaB grown to 6 h; Sample_W24, USA500 grown to 24 h; Sample_B24, USA500ΔctaB grown to 24 h. Heatmap shows the Euclidean distances between the samples as calculated from the variance-stabilizing transformation of the count data.
