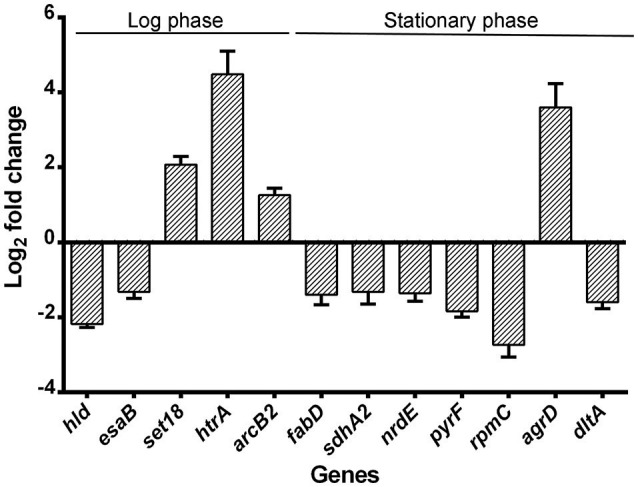
Figure 7.

Validation of RNA-seq by quantitative real-time PCR. Relative mRNA levels of transcripts corresponding to USA500 and ΔctaB mutant grown to 6 or 24 h were determined. RNA was obtained from the same samples for RNA-seq and experiments were performed in triplicate. Bars show the fold change of ΔctaB mutant vs. USA500 and error bars indicate standard deviations calculated with the 2−ΔΔCT method based on three independent experiments.
