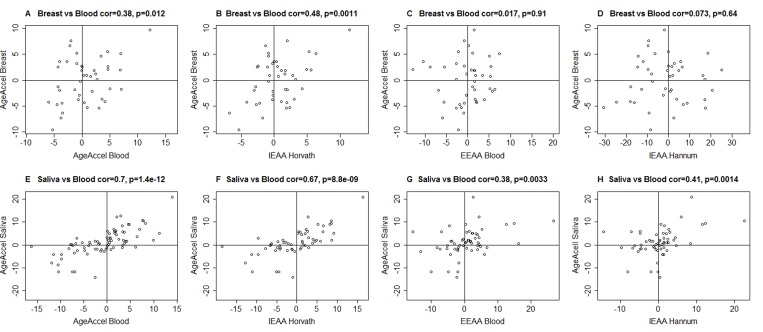
Figure 1. Epigenetic age acceleration in blood versus that in breast or saliva.
(A-D) Epigenetic age acceleration in healthy female breast tissue (y-axis) versus various measures of epigenetic age acceleration in blood: (A) universal measure of age acceleration in blood, (B) intrinsic epigenetic age acceleration based on the Horvath estimate of epigenetic age, (C) extrinsic epigenetic age acceleration, (D) intrinsic epigenetic age acceleration based on the Hannum estimate of epigenetic age. (E-H) analogous plots for epigenetic age acceleration in saliva (y-axis) and (E) AgeAccel, (F) IEAA based on Horvath, (G) EEAA, (H) IEAA based on the Hannum estimate. The y-axis of each plot represents the universal measure of age acceleration defined as the raw residual resulting from regressing epigenetic age (based on Horvath) on chronological age.

