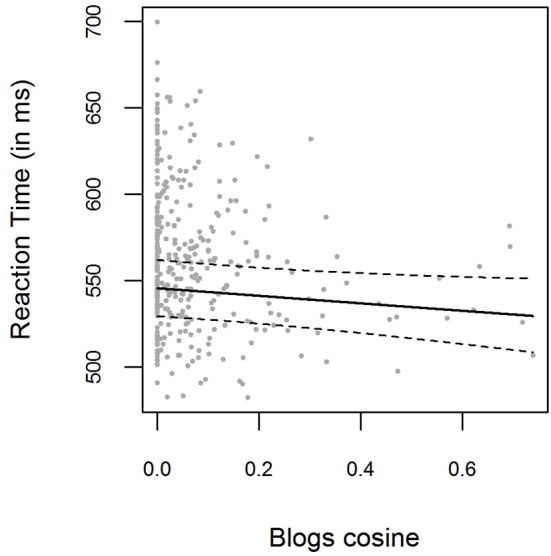
Figure 4.

Mean RTs for each item in the pooled data from Experiment 1 and Experiment 2, plotted as a function of the prime-target Blogs cosine similarity. The solid line shows the exponentiated model predictions of the model including cosine fixed effects, with the corresponding 0.95 confidence interval (dashed line).
