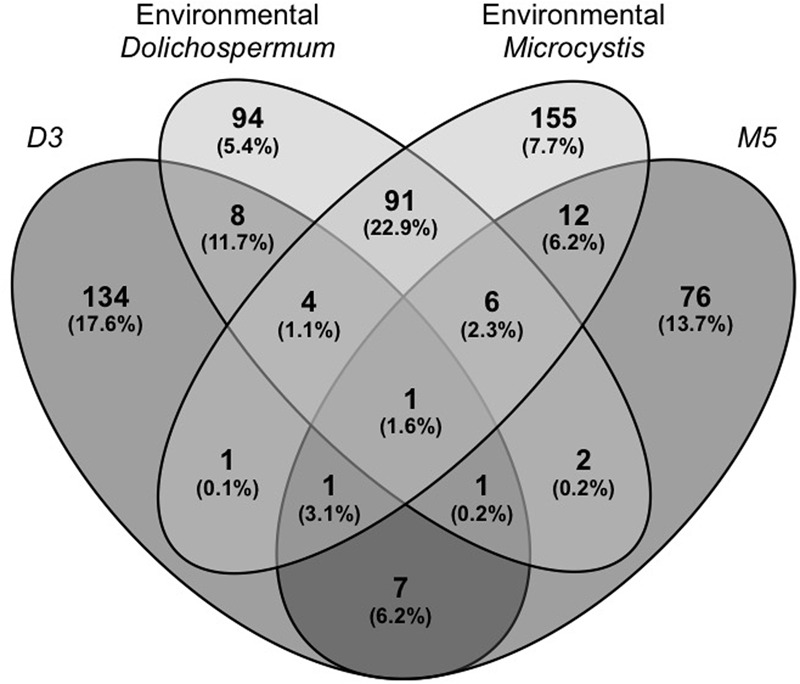
FIGURE 2.

Venn diagram showing the distribution and abundance of the bacterial OTUs found in the BCs sampled during the two natural blooms of Microcystis and Dolichospermum and in the BCs associated with the Microcystis (M5) and Dolichospermum (D3) strains in culture. The abundances (total read percentages) of these OTUs are represented in brackets. The number of reads was first added for the three replicates, and their abundances were then calculated for the different OTU groups based on total OTUs for these four cyanobacteria, both for natural blooms and individual strains (n = 12,048 reads). D3: BC associated with Dolichospermum strain 3 (isolated from Champs/Marne); M5: BC associated with Microcystis strain 5 (isolated from Champs/Marne); Environmental Dolichospermum/Microcystis: BC associated with the two bloom samples of Dolichospermum and Microcystis from Champs/Marne.
