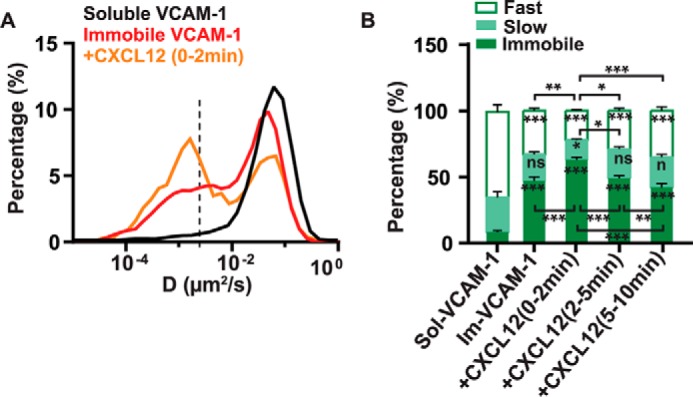
FIGURE 5.

Effect of immobilized VCAM-1 and CXCL12 co-stimulation on the lateral mobility of α4β1in T-cells. A, overlay semi-log distributions of D1–4 values for soluble VCAM-1 (black line), immobilized VCAM-1 (red line), and immobilized VCAM-1 together with CXCL12 stimulation for 2 min (orange line). Data from the soluble VCAM-1 stimulation experiments (Fig. 3) are included to allow easier comparison of both conditions. B, percentage of immobile, slow, and fast α4β1 subpopulations for the different stimulation conditions compared with soluble VCAM-1 (sol-VCAM-1). Im-VCAM-1, immobilized VCAM-1. 18 untreated cells on immobilized VCAM-1 (1920 trajectories), seven cells stimulated with CXCL12 for 0–2 min (759 trajectories), eight cells stimulated with CXCL12 for 2–5 min (865 trajectories), and 13 cells stimulated with CXCL12 for 5–10 min (1588 trajectories) over three separate experiments. ns, not significant (p > 0.05); *, p < 0.05; **, p < 0.01; ***, p < 0.001.
