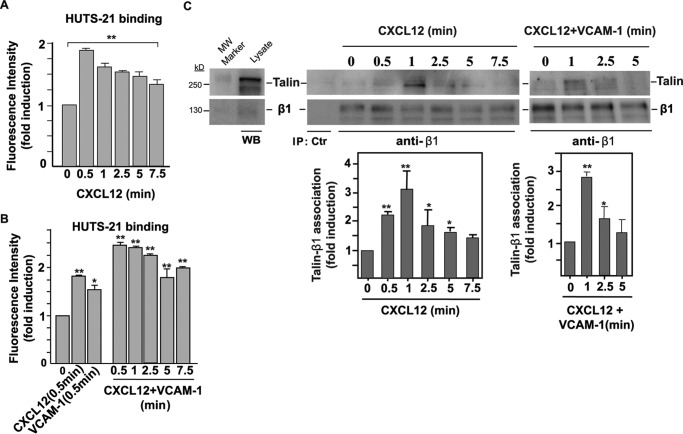
FIGURE 6.
Analyses of α4β1 integrin activation. A and B, Molt-4 cells were exposed for the indicated times to CXCL12 or VCAM-1-Fc alone and subjected to flow cytometry with the HUTS-21 anti-β1 mAb (n = 3). C, cells were exposed to CXCL12 alone (center panel) or combined with soluble VCAM-1-Fc (right panel) for the indicated times and subsequently subjected to immunoprecipitation with the TS2/16 anti-β1 mAb followed by immunoblotting with antibodies to the indicated proteins. Also shown are densitometric analyses of gel bands from the immunoprecipitations displaying the mean ± S.D. of four independent experiments (bottom panels). *, p < 0.05; **, p < 0.01. MW, molecular weight; WB, Western blot; IP, immunoprecipitation.

