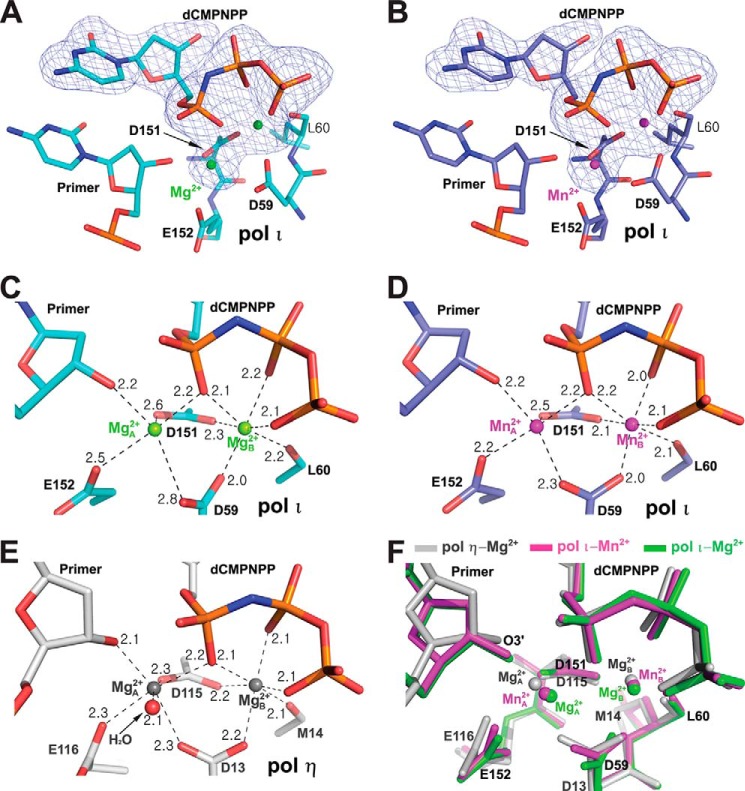
FIGURE 2.
Comparison of Mg2+ and Mn2+ coordinations in the pol ι active site. A and B, Fo − Fc simulated annealing omit maps (blue) contoured at 3.0σ for the incoming dCMPNPP and Mg2+ (A) or Mn2+ (B) ions in the active sites of pol ι. The electron density is superimposed on the refined modeled dCMPNPP and metal ions. Mg2+ and Mn2+ ions are shown as green and magenta spheres, respectively. C and D, close-up view of Mg2+ (C) or Mn2+ (D) coordination in the active-site metal binding sites of pol ι·G·dCMPNPP complexes. Metal ion coordination is shown as dashed lines, and the coordination distances are indicated. E, close-up view of Mg2+ coordination in the active-site metal binding site of pol η·G·dCMPNPP complex (PDB ID 4DL3). Mg2+ ions are shown as gray spheres. F, superposition of the active-site metal binding sites of the pol ι(26–445)·G·dCMPNPP·Mg2+ (green), pol ι(26–445)·G·dCMPNPP·Mn2+ (magenta), and pol η·G·dCMPNPP·Mg2+ (PDB ID 4DL3, gray) complexes. Red, blue, and orange colors indicate oxygen, nitrogen, and phosphorus atoms, respectively. Cyan (in A and C), light blue (in B and D), and light gray (in E) colors indicate carbon atoms.

