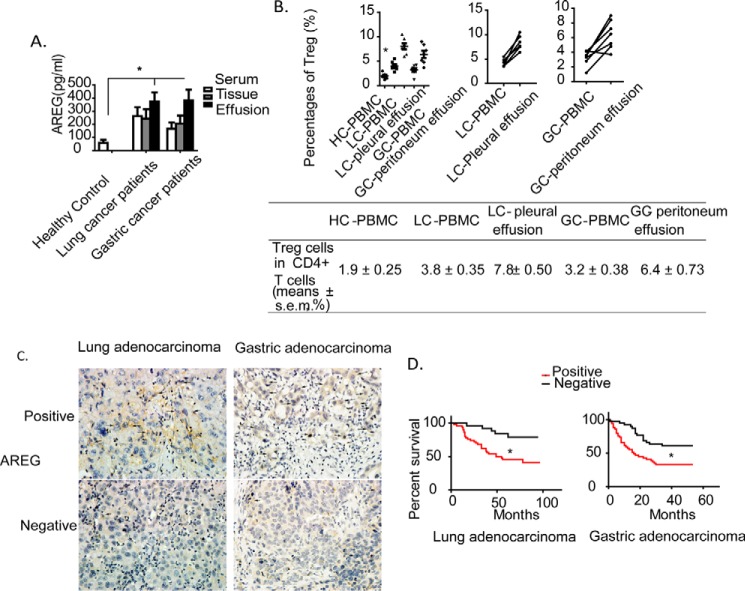
FIGURE 1.
Clinical association of AREG expression level and Treg cell ratio with survival of cancer patients. A, AREG expression levels in serum, tissue specimens, and effusions from HC donors and LC and GC patients. B, mean frequencies of CD4+CD25hiFoxp3+ Treg cells in CD4+ T cells from the indicated groups (top left, n = 7/group) and paired samples (top center and top right, n = 6/group). C, representative results of AREG immunoreactivity in tissue specimens of LC and GC patients. The arrows point to positive cells. D, Kaplan-Meier overall survival curves of AREG in LC and GC patients. *, p < 0.05.

