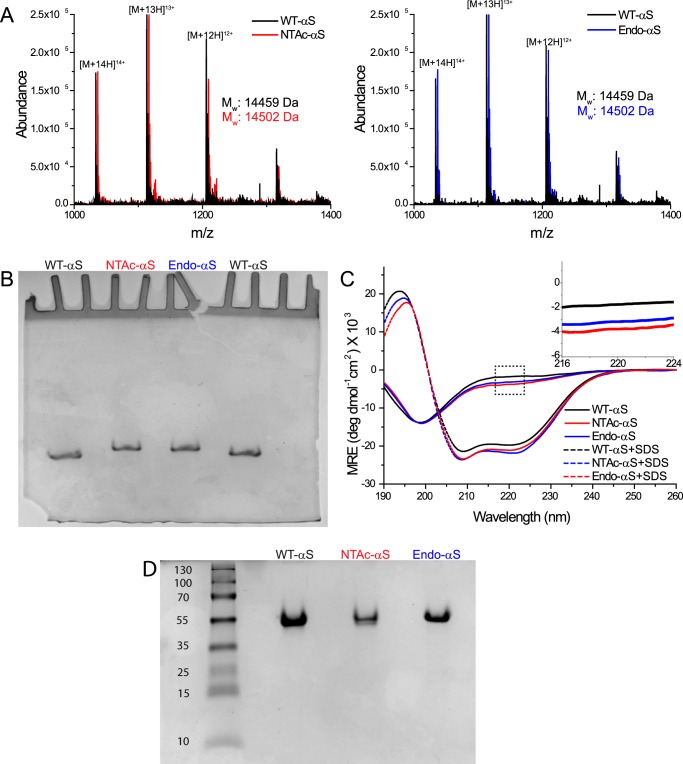
FIGURE 1.
Biochemical characterization of αS variants. A, ESI-MS data of purified monomeric WT-αS, NTAc-αS, and Endo-αS, respectively. All samples were prepared in 10 mm ammonium acetate buffer with the concentration of αS monomers kept constant at 15 μm. For a given m/z value, the corresponding charge state is indicated. Molecular masses (Mr) were calculated as follows: m/z value = [M + xH]x+. Mr = (m/z value × x) − x. B, acetic acid gel electrophoresis data of monomeric WT-αS, NTAc-αS, and Endo-αS. 5 μm of each protein sample was loaded into gels and as shown above, the relative migration of WT-αS was more than that of acetylated-αS, which migrated at similar positions. C, CD spectra showing the conformational transition from a random coil to a α-helix upon the addition of SDS micelles. The inset shows the slightly higher absorbance of acetylated-αS at 222 nm compared with WT-αS. All data obtained with WT-αS are depicted with black, with NTAc-αS with red, and Endo-αS with blue colors, respectively. D, native-PAGE gel of WT-αS, NTAC-αS, and Endo-αS showing absence of any higher ordered aggregates in either sample. A standard PageRulerTM Plus pre-stained protein ladder was loaded in the left-most lane and the numbers correspond to molecular masses in kDa. A minute band appears in the WT-αS lane very close to the beginning of the resolving gel, which is larger than 250 kDa in size.

