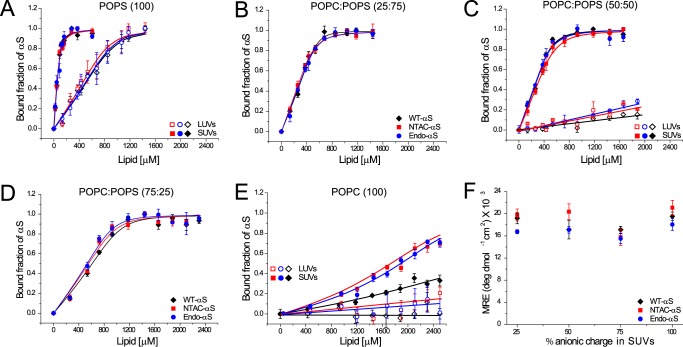
FIGURE 2.
Membrane binding characteristics of WT-αS, NTAc-αS, and Endo-αS. All data obtained with WT-αS are depicted with black diamonds/lines, NTAc-αS with red squares/lines, and Endo-αS with blue circles/lines. Open symbols in panels A, C, and E represent data obtained in the presence of LUVs and closed symbols represent data obtained in presence of SUVs. Binding curves of αS to 100% POPS liposomes (panel A), 25:75 POPC:POPS (panel B), 50:50 POPC:POPS (panel C), and 75:25 POPC:POPS (panel D) showing no differences in membrane binding of acetylated-αS compared with WT-αS. Binding curves of αS to POPC liposomes show hardly any binding of αS to membranes of this composition but acetylated-αS has a slightly higher affinity for 100% POPC SUVs than WT-αS (panel E). Average MRE values were obtained from the plateau phase of the binding curve obtained from CD spectroscopy measurements showing insignificant differences for either WT-αS or acetylated-αS indicating a similar size of helical domain on lipid membranes (panel F). All measurements were performed at room temperature in the presence of 10 mm Tris, 100 mm KCl buffered at pH 7.4. The error bars in all binding curves represent standard deviations from 3 independent measurements. The binding curves for LUVs (open symbols) shown in panels C and E could not be fitted using the solution to a simple quadratic equation (23) and the depicted lines are only a guide to the eye.

