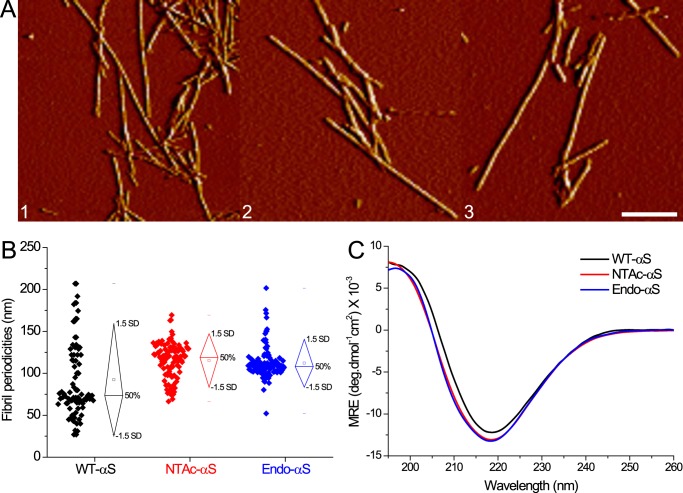
FIGURE 5.
AFM and CD spectroscopy of WT-αS and acetylated-αS fibrils. A, AFM amplitude images depicting fibrillar aggregates of WT-αS (panel 1), NTAc-αS (panel 2), and Endo-αS (panel 3). The scale bar is 250 nm. B, fibril periodicities measured from AFM images show slightly higher values for acetylated-αS compared with WT-αS. C, CD spectroscopy of purified αS fibrils show slightly higher β-sheet content in acetylated-αS fibrils than WT-αS fibrils. All fibrils were prepared in PBS buffer solutions and purified after aggregation to remove monomers.

