FIGURE 6.
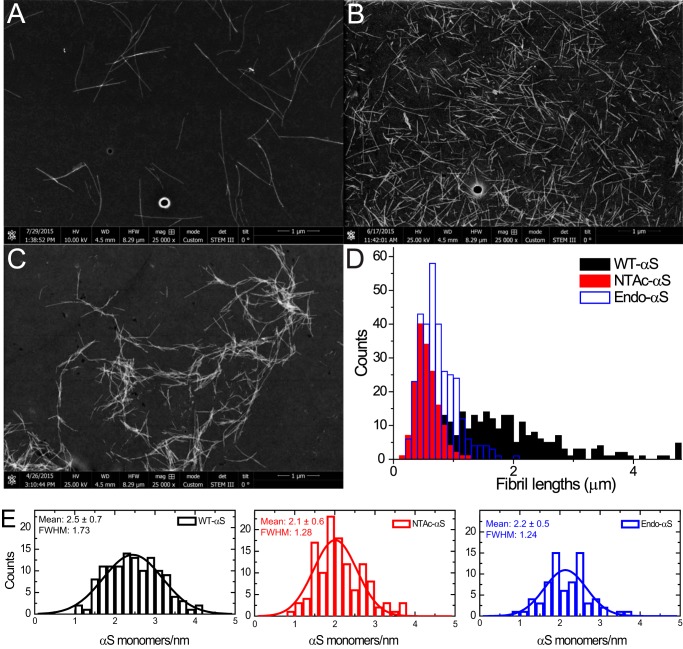
STEM measurements of WT-αS, NTAc-αS, and Endo-αS fibrils. Representative dark-field images of WT-αS (panel A), Endo-αS (panel B), and NTAc-αS (panel C) fibrils obtained post-aggregation in PBS buffer at 37 °C with constant shaking at 300 rpm. The fibrils were purified with a 100-kDa cutoff filter to remove the residual monomers before STEM imaging. The length distributions (panel D) were obtained using the Simple Neurite Tracer plugin (69) in Fiji software show a much smaller mean length acetylated-αS fibrils as compared with WT-αS fibrils. Histograms of mass per length measurements and their corresponding fitted Gaussian distributions are depicted as solid curves (panel E). Statistical analysis using one-way analysis of variance predict that the sample mean of WT-αS is significantly different from both acetylated-αS at p < 0.05.

