FIGURE 7.
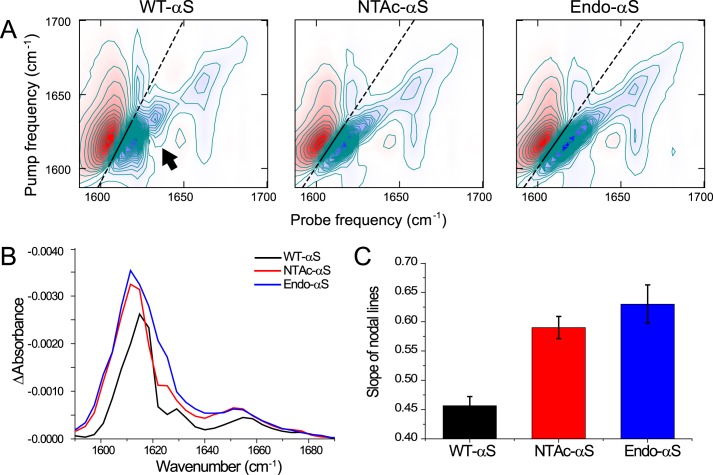
2D-IR spectra of αS fibrils. A, 2D-IR spectra showing solid straight lines that are fits through the zero crossings in the β-sheet region. The steeper slope of the line in the WT-αS fibril spectrum shows that the spectral heterogeneity is less in this spectrum as compared with the acetylated-αS spectra. The arrow indicates a cross-peak between the ∼1620 cm−1 and 1632 cm−1 peaks, which is only present in the WT-αS spectrum, indicating coupling between modes resulting from two different types of β-sheet structure. All fibrils were prepared in deuterated PBS buffer solutions and purified after aggregation to remove monomers. B, diagonal slices of the 2D-IR spectra to aid the recognition of the diagonal peaks described in the main text. To avoid distortion of the line shapes as a result of a large spectral width of the pump as compared with the anharmonicity that results in a distorting positive contribution of the induced absorption to the bleach signal that is plotted here, we plot the average between the diagonals that are blue shifted by one and two probe pixels. C, the nodal slopes that were obtained from the fitted straight lines through the zero crossings in the β-sheet region, showing a comparable spectral inhomogeneity for acetylated-αS fibrils, and a smaller inhomogeneity for WT-αS fibrils. We obtained the nodal slopes by calculating the frequencies where the signal goes through zero, between the induced absorption (red peak at lower probe frequency in panel A) and the bleach (blue peak at higher probe frequency in panel A), for each pump pixel in the 1600–1622 cm−1 region by interpolation of the data point right before and right after the zero crossing, and subsequently fitting a straight line through the interpolated zero crossings.

