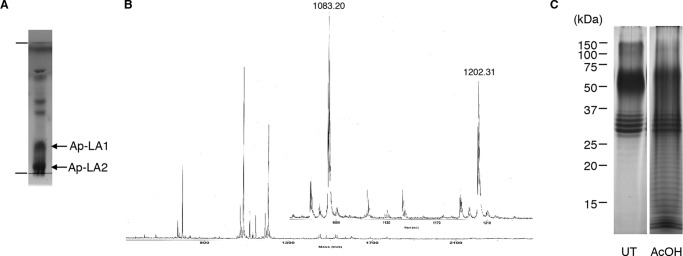
FIGURE 3.
Isolation of lipid A from A. pasteurianus LPS. A, TLC profile of the hydrophobic fraction obtained by weak acid hydrolysis followed by phase partitioning. TLC was performed using a solvent system consisting of CH3Cl-CH3OH-H2O (65/25/4, v/v/v) and visualized using anisaldehyde-sulfuric acid reagent. B, ESI-TOF-MS spectra of the hydrophobic fraction. The spectra were obtained with a Mariner instrument in negative ion refractor mode. C, SDS-PAGE profile of the untreated (UT) or hydrophilic fraction after weak acid hydrolysis (AcOH). The components were separated in 15% gel and visualized by periodic acid-silver staining.

