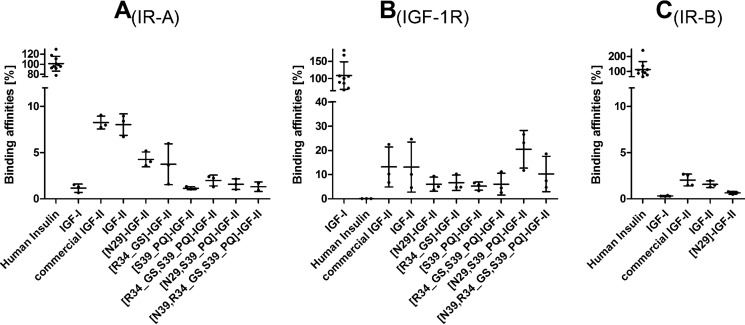
FIGURE 2.
Summary of receptor binding affinities. Shown is a bar plot representation of relative binding affinities (from Table 1) of native hormones and IGF-II analogs prepared in this work for human IR-A (A), IGF-1R (B), and IR-B (C). Error bars represent S.D.

