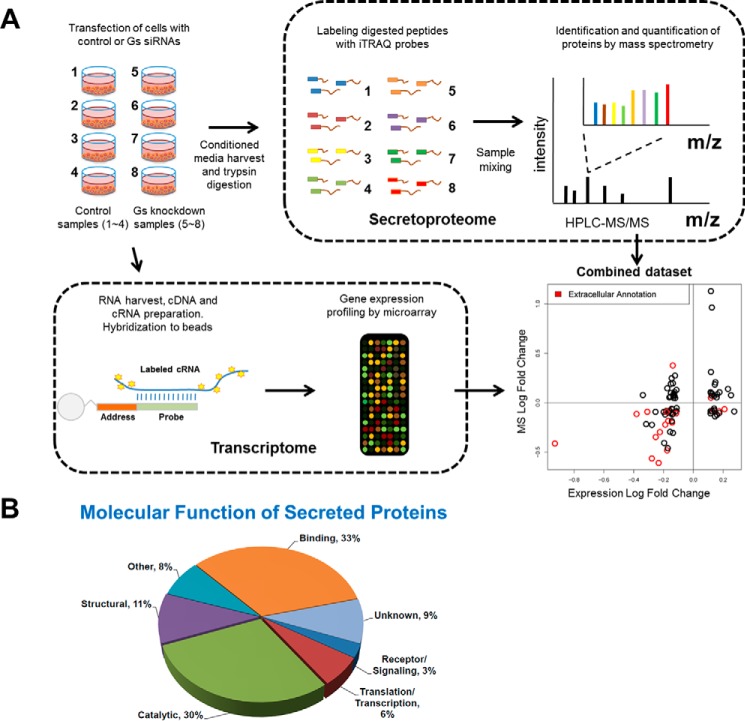
FIGURE 2.
LβT2 gonadotrope secretoproteome analysis. A, schematic representation of the experimental design used to identify secreted factors in LβT2 gonadotrope cells. Details are provided under “Experimental Procedures.” The integration of the secretoproteome and transcriptome data is also depicted in the bottom right corner. Briefly, log -fold changes of protein abundance (x axis) were plotted against log -fold changes of mRNA expression (y axis). Genes denoted with gene ontology cellular compartment of “extracellular region” or “secretory granule” were considered as potentially secreted and are denoted in red. Analysis details are provided under “Experimental Procedures.” B, gene ontology analysis of secreted proteins based on molecular function. Panther was used for the analysis.

