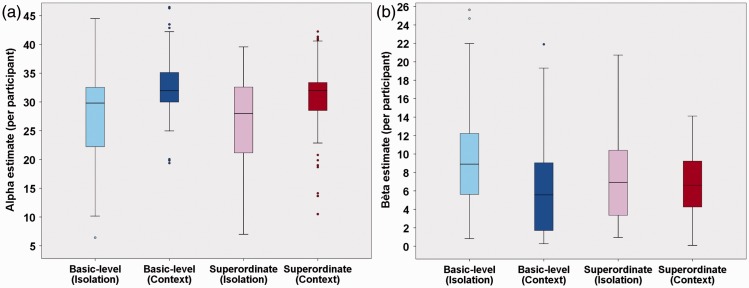
Figure 6.
Overview of the overall distribution of the (a) α and (b) β estimates of the participants. The different boxplots represent the four different conditions: basic-level object-in-isolation (light blue bar), basic-level object-in-context (dark blue bar), superordinate-level object-in-isolation (pink bar), and superordinate-level object-in-context (red bar).

