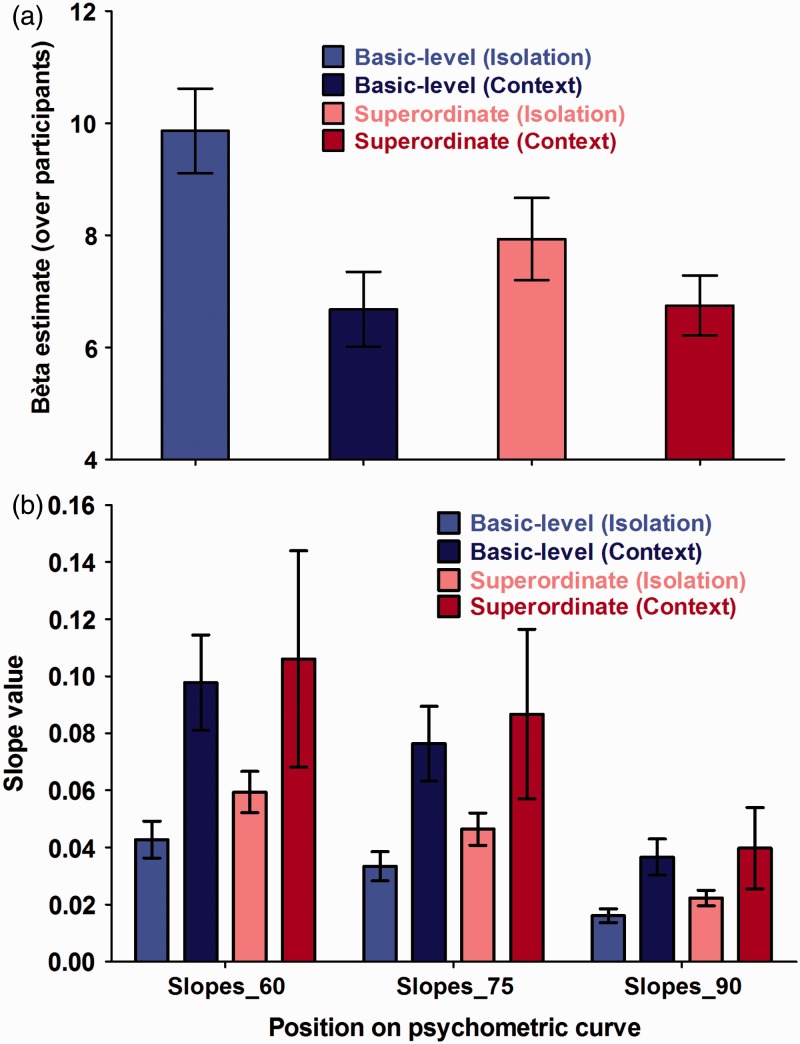
Figure 8.
Overview of (a) average β estimates across participants and (b) average steepness of the psychometric curve at 60%, 75%, or 90% correct categorization performance when rapidly detecting a basic-level object-in-isolation (light blue bar), a basic-level object-in-context (dark blue bar), a superordinate-level object-in-isolation (pink bar), or a superordinate-level object-in-context (red bar). The data are represented as the mean performance across participants, with error bars depicting the standard error of the mean (SEM).

