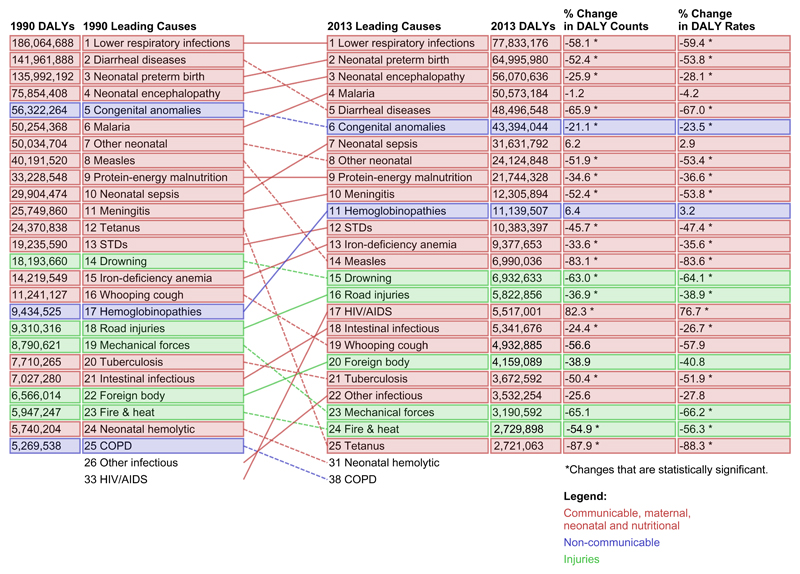
Figure 4b. Top 25 global causes of DALYs, under 5, both sexes, 1990 and 2013.
Footnote 1 (Figure 4b): Causes connecting with lines show changes in ranks between 1990 and 2013. The second column on the right-hand side shows the mean DALY counts. The third and fourth columns on the right-hand side show the median percent changes (calculated at the 1000 draw level) in the number and rates of global DALYs.
Footnote 2 (Figure 4b): *Changes that are statistically significant.

