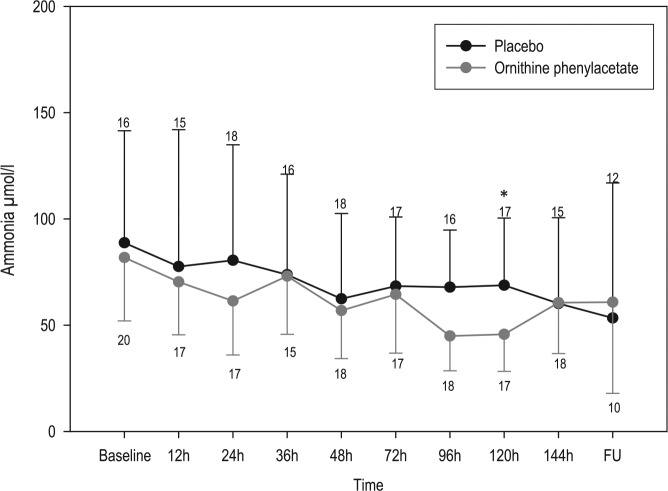
Figure 2.
Plasma ammonia-concentration evolution during the study period in the ornithine phenylacetate and placebo groups.
Data are mean and one-sided standard deviation. Numbers at each timepoint indicate the number of patients with plasma samples analyzed.
FU, follow up.
*p < 0.05, mean ammonia in treated group at 120 hours was significantly lower than placebo group.

