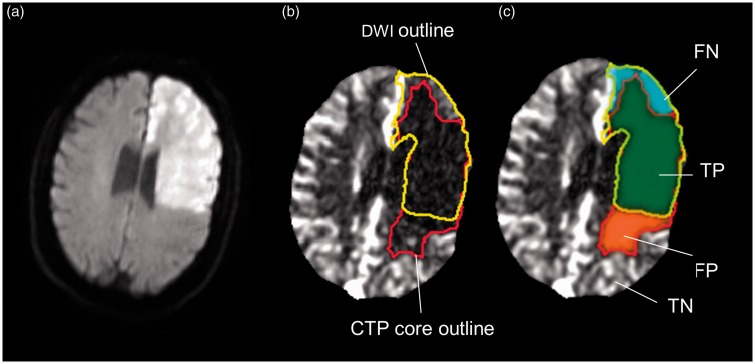
Figure 3.
Illustration of voxel-based analysis of infarct prediction. This case illustrates how the CTP benchmarking tool calculates the test-characteristics of CTP for identifying DWI positive voxels. The DWI (a) is co-registered to the CTP (b and c). The rCBF estimate (red outline) of the ischemic core and the gold standard DWI (yellow) are shown in panel (b). CTP test characteristics are based on the regions shown in panel (c). TP (true positive) are voxels that are included in the CTP-rCBF and the DWI infarct outlines (green); FP (false positive) are voxels included in the CTP-rCBF outline but not the DWI outline (red); FN (false negative) are voxels included in the DWI outline but not the CTP-rCBF outline (blue); TN (true negative) are voxels that are not included in the DWI or the CTP-rCBF outline but have prolonged Tmax defined as Tmax>4 (region not shown to maintain a clear depiction of the rCBF and DWI outlines).

