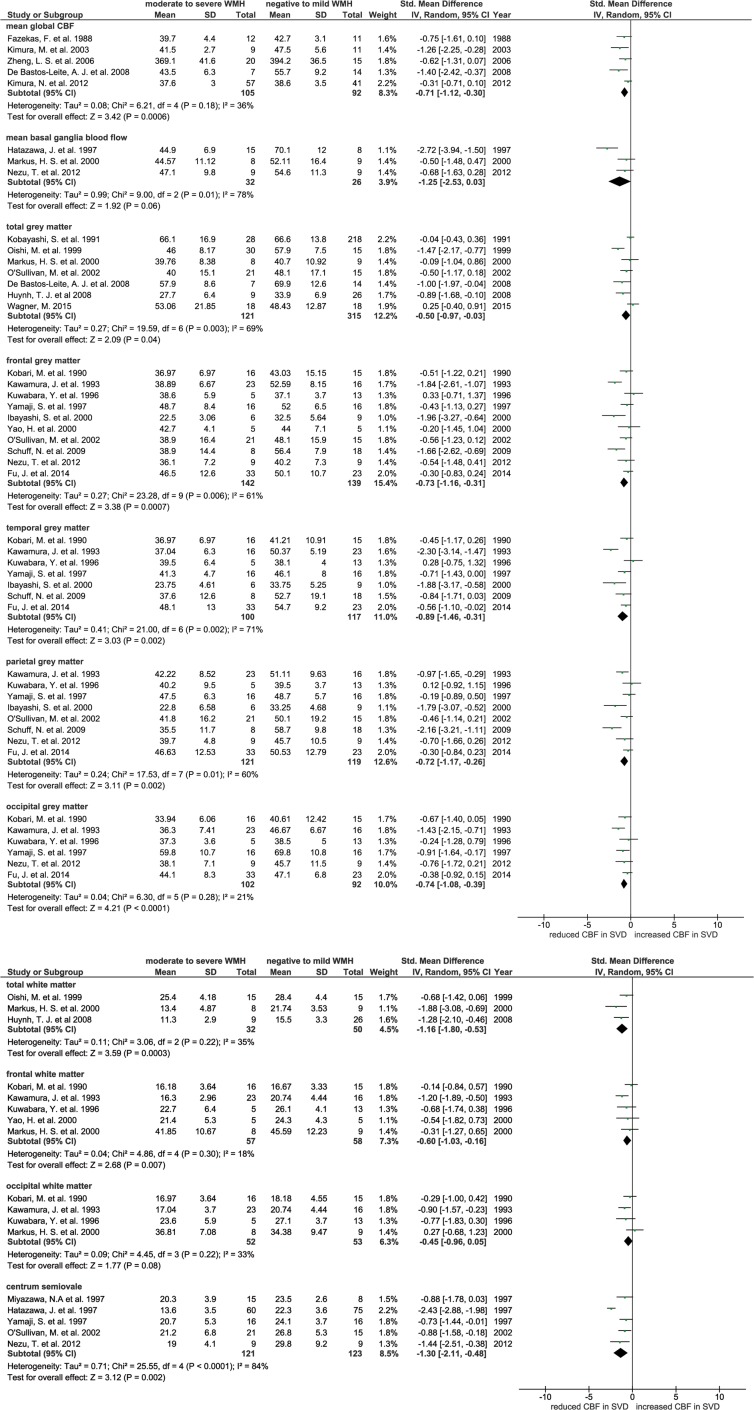
Figure 2.
(a) Forest plot showing standard mean differences in global and grey matter CBF in patients with WMH in dementia and non-dementia studies. CBF in different brain regions was analysed in subgroups. (b) Forest plot showing standard mean differences in white matter CBF in patients with WMH in dementia and non-dementia studies. CBF in different brain regions was analysed in subgroups.
CBF: cerebral blood flow; WMH: white matter hyperintensity.

