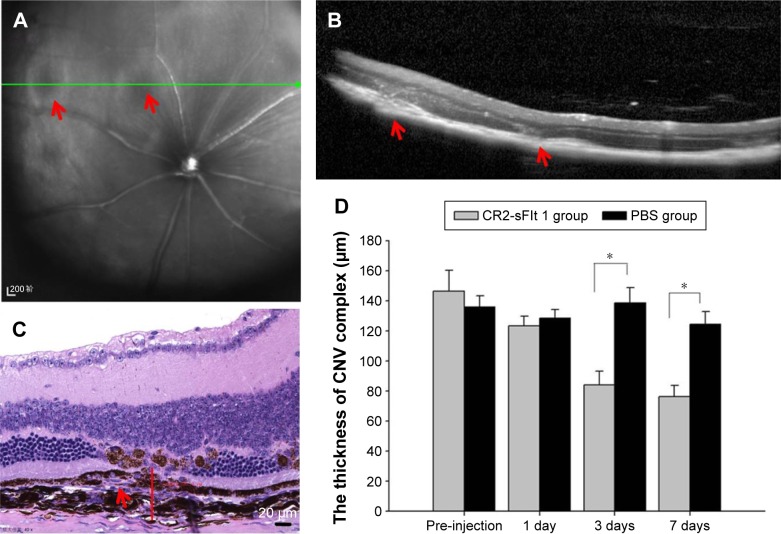
Figure 2.
CNV model (A–C) and therapeutic assessment of CR2-sFlt 1 (D).
Notes: (A) IR fundus image of CNV mice induced by laser at the seventh day (green line is scan position of Figure [B], red arrows show laser spot). (B) OCT of CNV mice induced by laser at the seventh day (red arrows show CNV position). (C) The thickness of the CNV complex (red line marking) in morphology measured through HE staining (red arrow shows CNV complex). (D) The thickness analysis of the CNV complex in mice after CR2-sFlt 1 or PBS treatment. Data are expressed as mean ± standard deviation. *P<0.05.
Abbreviations: CNV, choroidal neovascularization; IR, infrared radiation; OCT, optical coherence tomography; HE, hematoxylin and eosin; PBS, phosphate-buffered saline.

