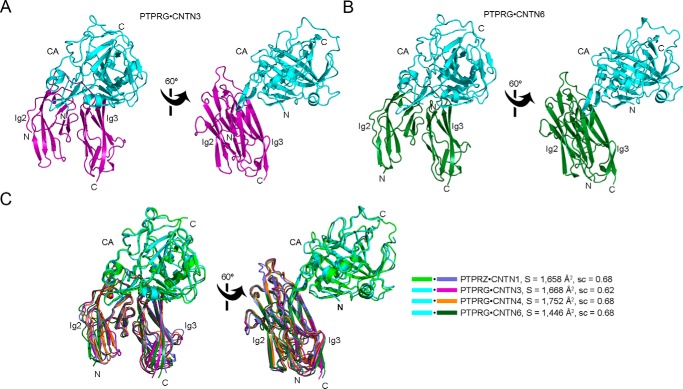
FIGURE 2.
A conserved arrangement of complexes formed by the CA domains of PTPRG/Z and domains Ig2-Ig3 of CNTNs. The PTPRG(CA)·CNTN3(Ig2-Ig3) and PTPRG(CA)·CNTN6(Ig2-Ig3) complexes are shown in ribbon diagrams along with an overlay of all the complexes formed by PTPRG, PTPRZ, and their CNTN-binding partners. The CA domains of PTPRG and PTPRZ are colored cyan and green, respectively. Repeats Ig2-Ig3 of CNTN1, CNTN3, CNTN4, and CNTN6 are colored slate, magenta, orange, and dark green, respectively. N and C, N and C termini, respectively. A, the CA domain of PTPRG bound to the Ig2-Ig3 repeats of CNTN3. B, the CA domain of PTPRG bound to the Ig2-Ig3 repeats of CNTN6. C, structural comparison of the PTPRZ·CNTN1, PTPRG·CNTN3, PTPRG·CNTN4, and PTPRG·CNTN6 complexes. The complexes were superimposed by fitting domains Ig2-Ig3 of CNTN4 with the homologous repeats in CNTN1 (RMSD 1.27 Å over 186 equivalent Cαs), CNTN3 (RMSD 0.97 Å over 180 equivalent Cαs), and CNTN6 (RMSD 1.16 Å over 195 equivalent Cαs). The buried surface areas and the surface complementarity coefficients for each complex are shown beside the structure overlay.

