FIGURE 3.
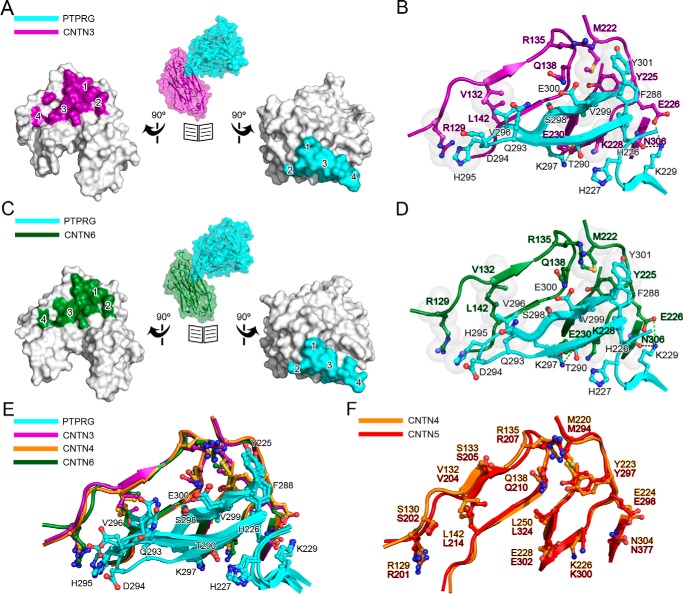
Conserved interactions at the PTPRG·CNTN interfaces. A, open book surface representation of the complex between the CA domain of PTPRG and CNTN3 repeats Ig2-Ig3. CNTN3 residues at the complex interface are colored magenta, whereas PTPRG residues are colored cyan. Binding sites 1–4 are labeled on the CNTN3 and PTPRG surfaces. B, detailed view of the PTPRG·CNTN3 interface. This view is in the same orientation as the ones shown on the left in Fig. 2. Translucent gray spheres highlight residues involved in van der Waals contacts. Dashed lines indicate potential hydrogen bonds (black) and salt bridges (green). C and D, same as A and B, but for the complex between the CA domain of PTPRG and CNTN6 repeats Ig2-Ig3. E, structural comparisons of the interfaces in the complexes formed by PTPRG and CNTN3, -4, and -6 (colored cyan, magenta, orange, and dark green, respectively). F, overlay of the PTPRG-binding region of mouse CNTN4 (orange) and mouse CNTN5 (red). The PTPRG-binding residues in CNTN4 are strictly conserved in CNTN5.

