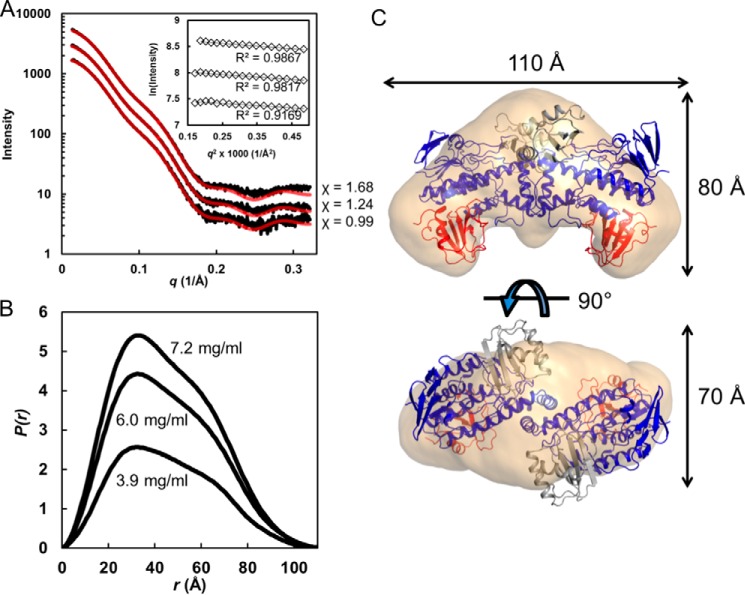
FIGURE 5.
SAXS analysis. A, SAXS curves from three RIFMO samples at different concentrations (from the top: 7.2, 6.0, and 3.9 mg/ml). Black curves, experimental data. The highest concentration curve has been offset for clarity. The red curves are theoretical SAXS profiles calculated from the crystallographic homodimer with FoXS (23). Goodness of fit values (χ) are listed on the right. The inset shows Guinier plots. B, distance distribution functions, P(r). C, shape reconstruction calculated with assumed 2-fold symmetry.

