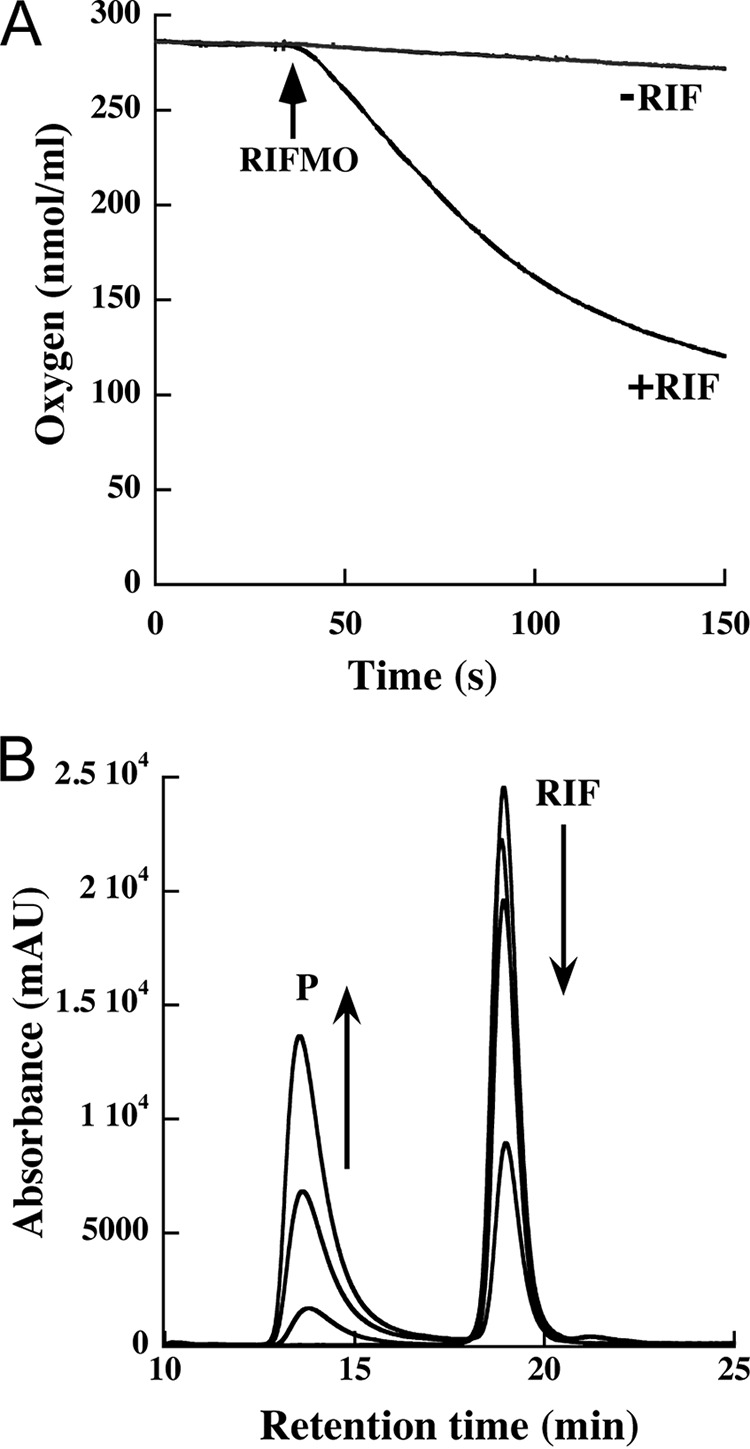
FIGURE 6.

Steady-state kinetics and HPLC analysis of RIF oxidation. A, oxygen consumption monitored with 0.5 mm NADPH in the absence (rate = 0.13 ± 0.01 s−1) and presence of 50 μm RIF substrate (rate = 2.3 ± 0.2 s−1). The arrow indicates the reaction initiation by the addition of 1 μm RIFMO. The oxygen consumption assays were done in a 1-ml mixture of 100 mm sodium phosphate, pH 7.5, at 25 °C. The rates were obtained from the slope of the initial linear portions of the curves, just after the addition of RIFMO. B, production of hydroxylated RIF by RIFMO. An HPLC chromatogram (340 nm) shows the elution of RIF and hydroxylated RIF (P). The arrows show the RIF peak decreasing and the P peak increasing at 0, 10, 30, and 60 s. mAU, milliabsorbance units.
