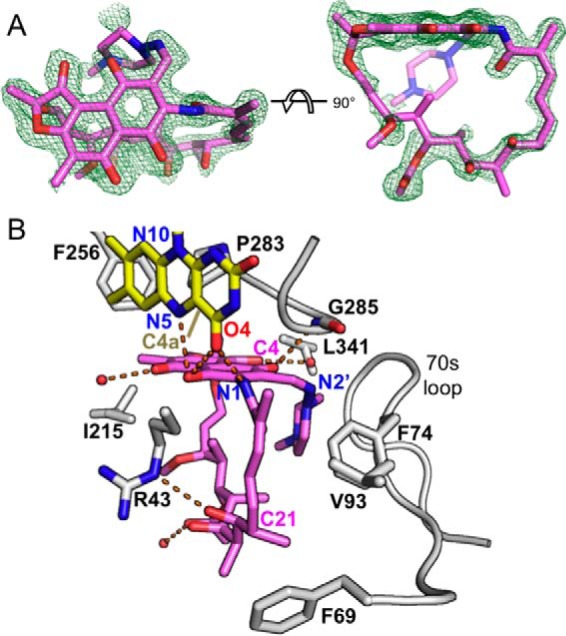
FIGURE 7.

Electron density and interactions for RIF bound to RIFMO. A, two views of the electron density for RIF. The cage represents a simulated annealing FO − FC map contoured at 3.0 σ. Note that the methylpiperazine atoms have been deleted in the deposited PDB file to reflect the lack of observable electron density. B, interactions between RIF and RIFMO. The residues involved with interactions are in white. RIF (pink), FAD (yellow), and residues contacting RIF are shown as sticks. Water molecules are shown as red spheres, and hydrogen bonds are colored as orange dashed lines.
