FIGURE 7.
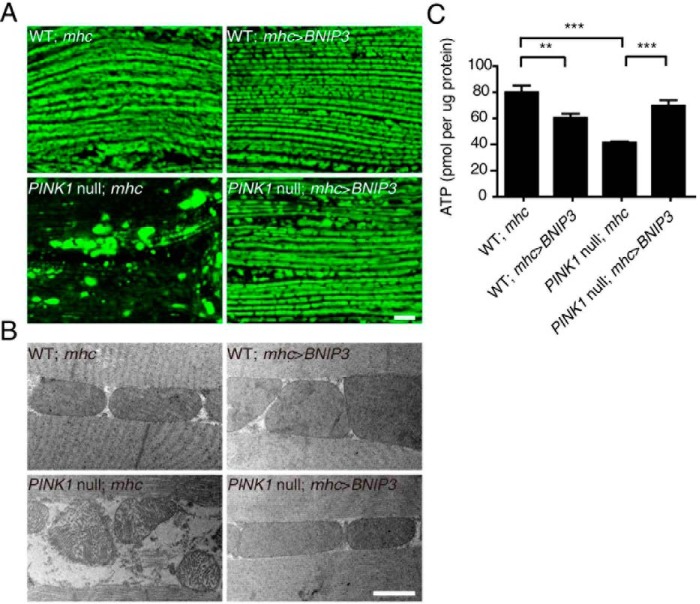
BNIP3 restores mitochondrial morphology and ATP production of PINK1 null Drosophila. A, mitoGFP (green)-labeled mitochondria in IFM of WT and PINK1 null mutant Drosophila expressing either mhc-gal4 (mhc) or mhc-gal4-driven BNIP3 (mhc>BNIP3) are shown. Note that mitochondrial aggregates are seen in PINK1 null flies and suppressed by muscle-specific expression of BNIP3 (PINK1 null; mhc>BNIP3). Bar = 10 μm. B, TEM images of mitochondria in IFM. Representative images of WT and PINK1 null mutant Drosophila expressing either mhc-gal4 or mhc-gal4-driven BNIP3 (mhc>BNIP3) are shown. Bar = 1 μm. C, ATP production of thoraces. ATP levels in thoraces of WT and PINK1 null mutant Drosophila expressing either mhc-gal4 or mhc-gal4 driven BNIP3 (mhc>BNIP3) are measured and analyzed by one-way ANOVA and Tukey's test. Error bars, represent S.E.; n = 5. **, p < 0.01; ***, p < 0.001. Note that PINK1 null expression results in decreased ATP production, which is restored by muscle-specific expression of BNIP3.

