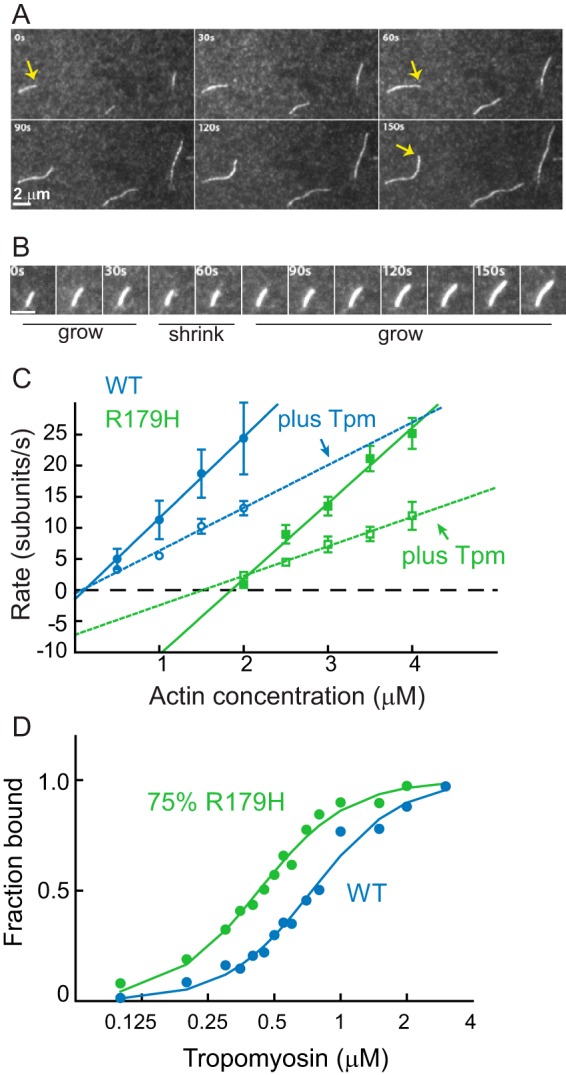
FIGURE 2.

Quantification of R179H actin filament growth observed by TIRF microscopy and tropomyosin binding affinity. A, growth of filaments from 4 μm R179H G-actin as a function of time. Each panel is separated by 30 s. The yellow arrow marks the growth of one filament. Bar in bottom left corner is 2 μm. B, time series images showing the growing and shrinking of R179H filaments at 2.5 μm actin. The white bar in the lower left corner is 2 μm long. C, rate of filament growth as a function of actin concentration for WT SM α-actin (blue) and R179H (green) actin, in the absence (solid line) or presence (dashed line) of smooth muscle tropomyosin. Error bars are S.E. Parameters obtained from these data (assembly rate, disassembly rate, and critical concentration) with multiple independent preparations are given in Table 1. D, affinity of WT (blue) and R179H (green, filaments formed from 25%WT and 75% R179H actin) F-actin for smooth muscle tropomyosin determined by an actin pelleting assay. Maximal binding was normalized to 1. Data were fit to the Hill equation. Kapp for WT is 1.3 × 10⁶ m−1 and for R179H is 2.3 × 10⁶ m−1. The Hill coefficient is 2.2 for WT and 2.1 for R179H.
