
FIGURE 3.
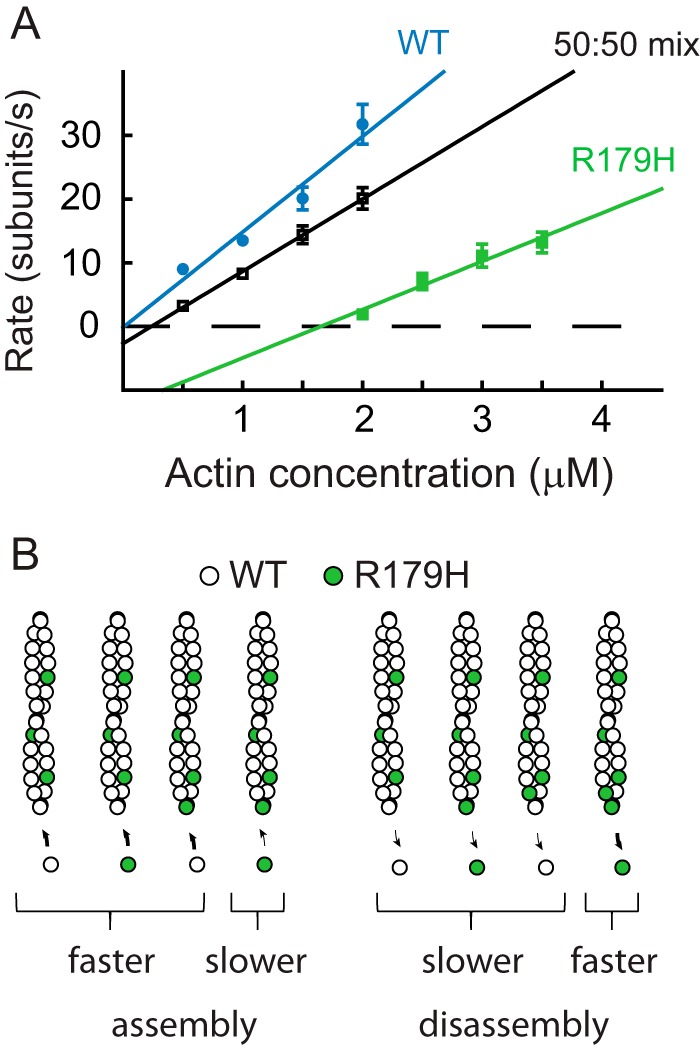
Copolymerization of equal amounts of WT and R179H actin. A, rate of filament growth versus actin concentration graph for WT SM α-actin (blue), R179H (green), and an equimolar mixture of WT and R179H actin (black). Error bars are S.E. B, schematic of a simple model to explain the copolymerization data (see “Experimental Procedures” for details). The slower assembly rate of the mutant actin occurs only when R179H adds onto a filament with a mutant protomer at the end. Disassembly only occurs at the fast mutant rate if both end protomers are R179H actin. Table 2 tabulates the polymerization parameters and values calculated from the model.