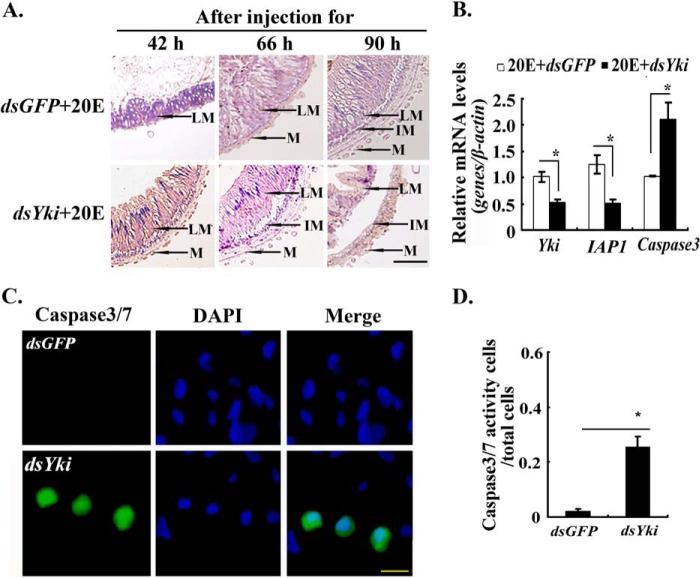
FIGURE 4.
Yki knockdown accelerated midgut apoptosis. A, midgut morphology after dsYki or dsGFP injection as detailed in Fig. 3. LM, larval midgut; IM, imaginal midgut; M, muscle. The scale bar represents 50 μm. B, qRT-PCR showing the mRNA levels of IAP1 and Caspase3 after dsYki injection for 66 h in larval midgut in the above treatment. β-actin was used as the control. The asterisks denote significant differences (0.01 < p < 0.05, via Student's t test) based on three replicates. C, Yki knockdown increased Caspase3/7 activity in HaEpi cells. Caspase3/7 activity was detected in dsGFP and dsYki cells (dsRNA 2 μg/ml). Green fluorescence represents the Caspase3/7 activity, as assessed using a Caspase3/7 activity detection kit. Blue fluorescence indicates DAPI-stained nuclei. “Merge” is the superimposed images of the green and blue fluorescence. Fluorescence was observed using an Olympus 257 BX51 fluorescence microscope. The scale bar represents 25 μm. D, statistical analyses of the ratio of Caspase3/7 activity cells in the total cells by ImageJ software. The values are expressed as the means ± S.D. (n = 3). The asterisks indicate significant difference calculated by Student's t test from three independent experiments.

