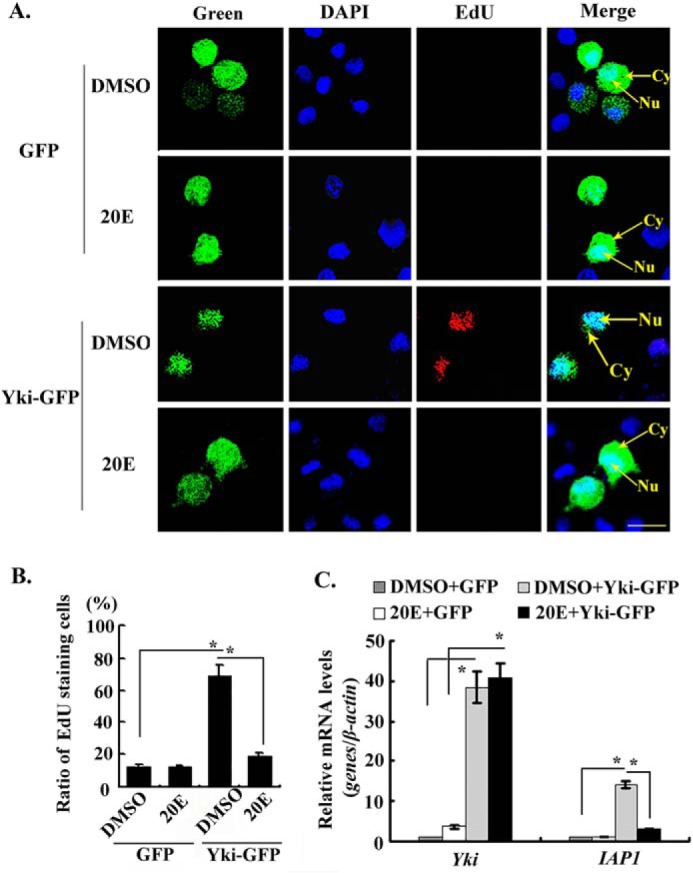
FIGURE 5.

20E suppressed the proliferation function of Yki. A, the overexpression of GFP-His and Yki-GFP-His in HaEpi cells and detection of cell proliferation by EdU. Green, GFP-His and Yki-GFP-His. 20E (5 μm) treated cells for 24 h. The same volume of DMSO was used as the control. Blue, nucleus stained with DAPI; red, EdU; Merge, the overlapped red, green, and blue. Bar, 20 μm. B, statistical analysis of the percentage of EdU staining cells in various treatments using ImageJ software. The values are expressed as the means ± S.D. (n = 3). The asterisks indicate significant differences between the groups (p < 0.05). Student's t test was based on three independent experiments. C, detection of the expression level of IAP1 in various treatments by qRT-PCR. The asterisks indicate significant differences calculated by Student's t test from three independent experiments.
