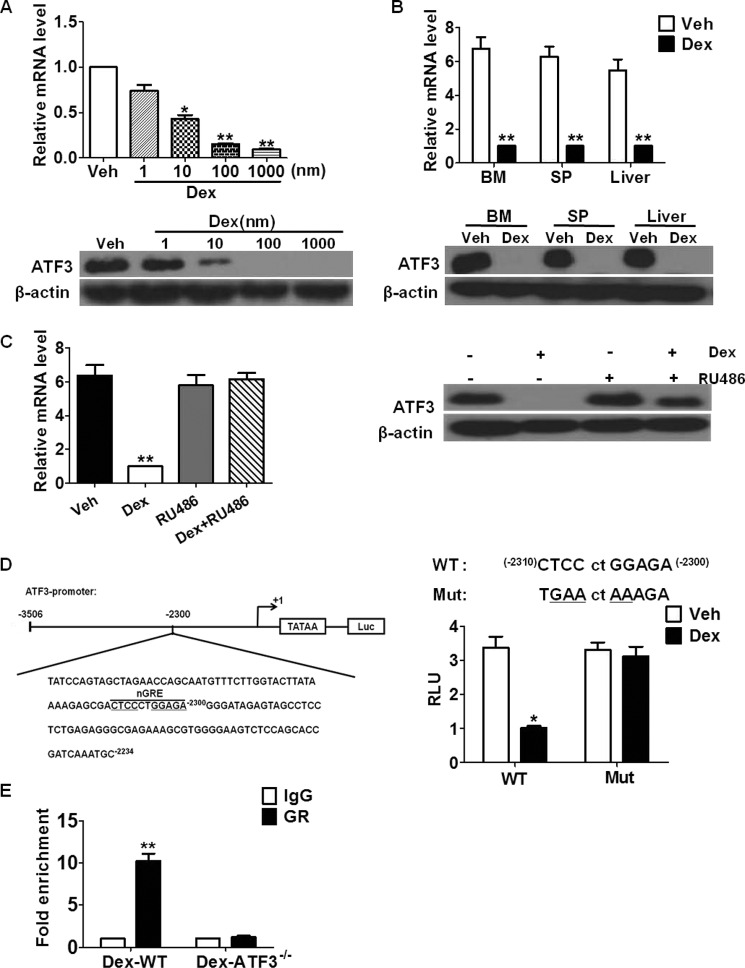
FIGURE 4.
ATF3 is transrepressed by GR in MDSCs. A, BM cells were treated with Dex at indicated concentrations, and ATF3 expression was measured by qRT-PCR (upper) and WB (lower). B, ATF3 expression in sorted MDSCs from BM, spleen (SP), and liver was determined by qRT-PCR (upper) and Western blotting (lower). C, BM cells were treated as indicated, ATF3 expression was measured by qRT-PCR (left) and Western blotting (right). RU486, GR antagonist. D, left, scheme of ATF3 promoter sequence with potential nGRE indicated. Right, site-directed mutant (Mut): ATF3-Luc activity, 32D cells transfected with pATF3/Luc plasmid were treated with Dex, and luciferase activity was measured using the Dual-Luciferase Reporter Assay (Promega). RLU, relative luciferase unit. E, ChIP assay was performed on BM cells from Dex-treated WT or ATF3−/− mice; using anti-GR or anti-IgG antibody, the presence of ATF3 promoter harboring the nGRE was determined by qRT-PCR. Data were normalized against input and presented as fold increase over IgG control. A–E, results were graphed as mean ± S.E. from three independent experiments; Western blottings in A–C were representative data from three independent experiments, each sample was pooled from three mice. *, p < 0.05; **, p < 0.01, unpaired t tests were used.

