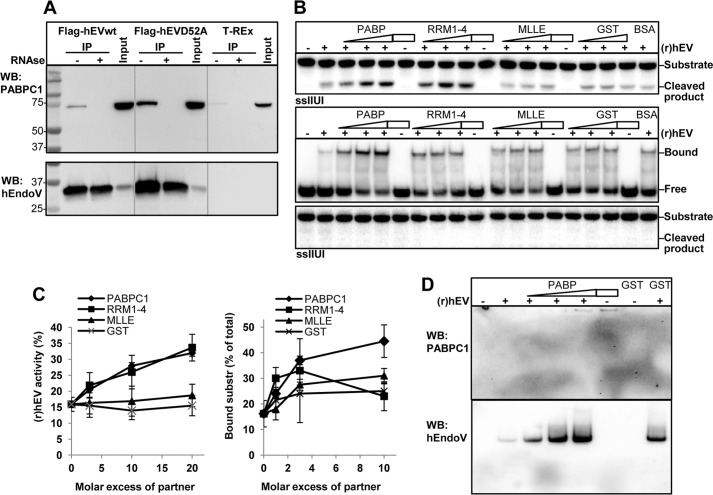
FIGURE 4.
Interaction between hEndoV and PABPC1. A, protein extracts were made from T-REx 293 cells expressing FLAG-hEndoVwt and FLAG-hEndoV(D52A). FLAG-hEndoVwt and D52A were isolated using anti-FLAG beads and co-precipitated material was separated by SDS-PAGE. Extract without hEndoV overexpression (T-REx) was used as control for unspecific binding to the beads and input represents the starting material (1.5 mg). Addition of RNase to the samples is indicated (−/+). After blotting, the membrane was probed with a PABPC1 antibody (upper panel). The membrane was stripped and reprobed with a hEndoV antibody (polyclonal; in house)(lower panel). Gray lines are drawn to separate the three extracts. B, upper panel, (r)hEndoV (0.2 nm) was incubated with the single-stranded IIUI substrate and increasing amounts of PABPC1, RRM1–4, MLLE, GST (0.6–1.8–3.6 nm), or BSA (3.6 nm) and activity was measured by denaturing PAGE. Samples without (r)hEndoV (−) contained protein (3.6 nm) as indicated. Middle panel, (r)hEndoV (70 nm) was incubated with the single-stranded IIUI substrate and increasing amounts of the same proteins as above (70–200-700 nm) or a fixed amount of BSA (700 nm) and a band shift assay was performed. Samples without (r)hEndoV (−) contained protein (700 nm) as indicated. Lower panel: a fraction of the EMSA reactions was analyzed for cleavage by 20% denaturing PAGE. C, cleavage and band shift in B was quantified in two-three separate experiments with two parallels in each. Error bars indicate S.D. D, yet another fraction of the EMSA reactions was run on a separate native EMSA gel, blotted onto a nylon membrane, and subjected to Western analysis. The membrane was probed first with PABPC1 antibody (upper panel) prior to hEndoV antibody (polyclonal, in house).

