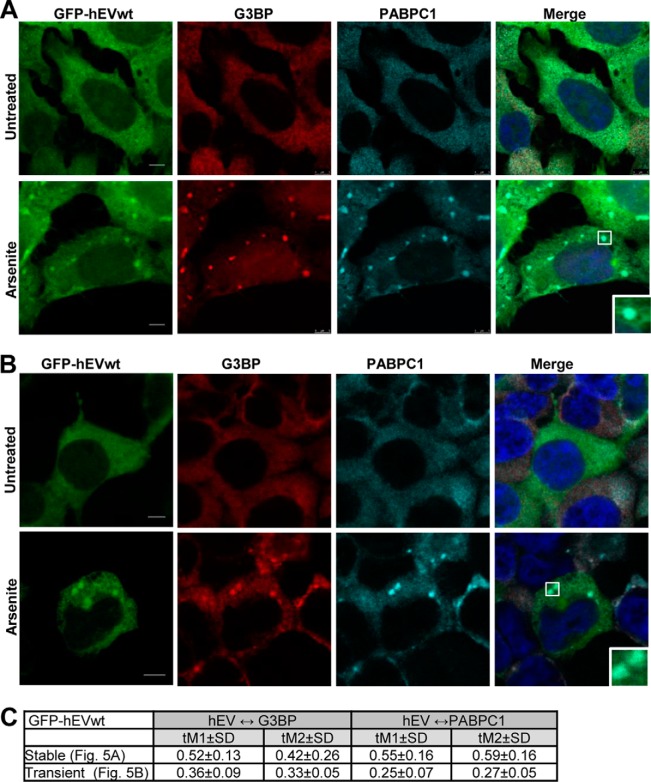
FIGURE 5.
hEndoV and PABPC1 colocalize in cytoplasmic stress granules. A, T-REx 293 cells stably transfected and B, HEK 293T cells transiently transfected with GFP-hEndoVwt were left untreated or exposed to arsenite (0.5 mm, 30 min), fixed, and processed for confocal microscopy. Cells were stained with PABPC1 (cyan) or G3BP (red) antibodies and DAPI (blue) to visualize the nuclei. GFP-hEndoV is shown in green. Localization of proteins was observed by confocal microscopy (Leica SP8) using a ×40 oil objective. Bar, 5 μm. Representative images are shown. C, the Manders' coefficients for colocalization (tM1 and tM2 ± S.D.) were determined for cells stably or transiently expressing GFP-hEndoVwt. tM1 ± S.D. expresses the degree of colocalization of the green channel (GFP-hEndoV) with the red/cyan channel (G3BP/PABPC1). tM2 ± S.D. expresses the degree of colocalization of the red/cyan channel with the green channel.

