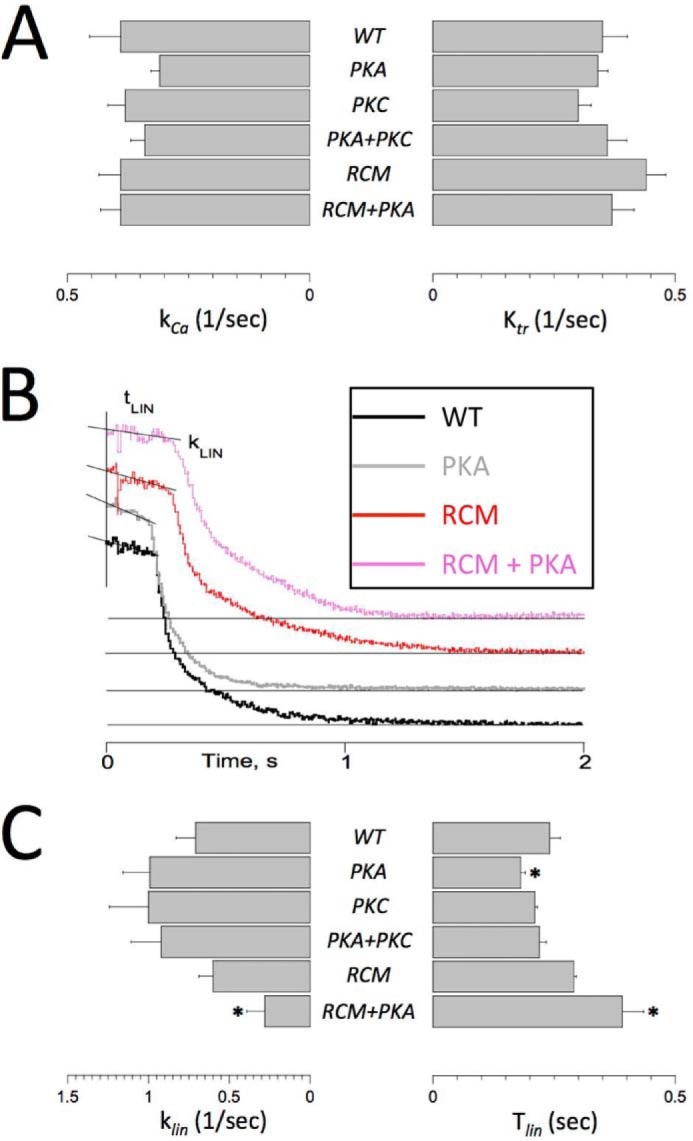
FIGURE 4.

Single myofibril activation/relaxation kinetics. Single myofibril activation/relaxation and release-restretch kinetics were measured in human recombinant troponin-exchanged isolated single myofibrils. A summarizes the average rate of force development upon a rapid (<5-ms) switch of bathing [Ca2+] from pCa = 10 to pCa = 4.5 (kCa; left panel) and the rate of force redevelopment following a rapid release-restretch maneuver during steady-state force development (ktr). There were no significant differences between the experimental groups, indicating that neither RCM nor PKA/PKC directly affect cross-bridge cycle kinetics. B, original recordings of force relaxation upon a rapid switch of bathing [Ca2+] from pCa = 4.5 to pCa = 10. Force relaxation took place in two distinct phases, a slow almost linear decline followed by a rapid pseudo-exponential decline back toward baseline (indicated by the thin horizontal lines); note that the force traces have been offset vertically to aid visualization of the individual traces. Two parameters of the slow force relaxation, klin and the Tlin, were measured as indicated; the rate of fast relaxation was estimated by exponential fit of the force data (not shown). C, average slow force relaxation fit parameters (klin and Tlin). Experiments were performed at 15 °C. Data are presented as mean ± S.E. *, p < 0.05 versus WT (RCM, n = 7; all other groups, n = 6). Error bars reflect S.E.
