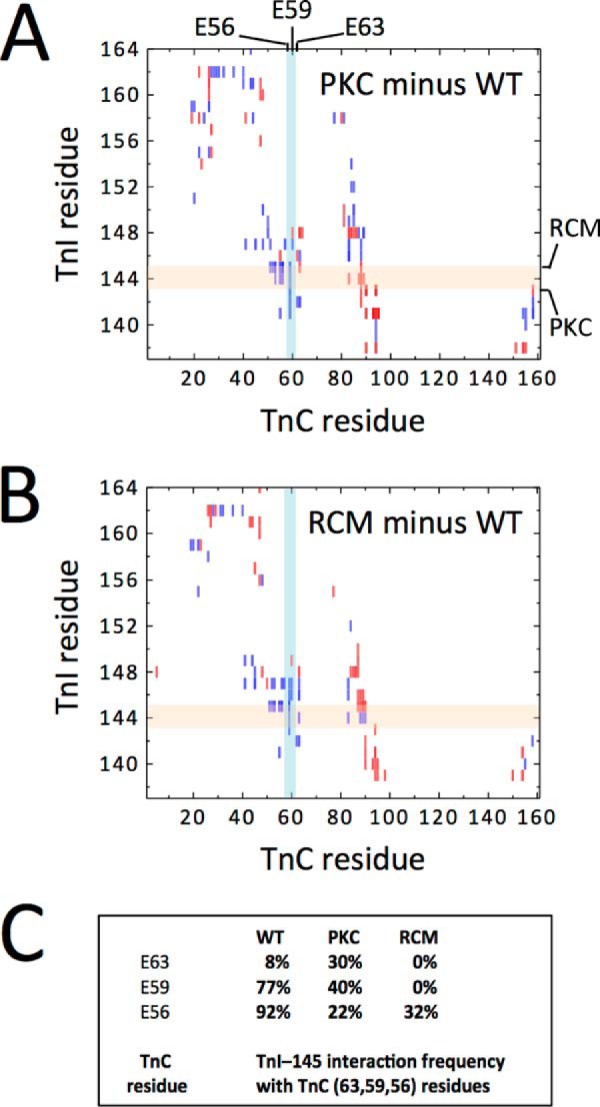
FIGURE 6.

Interaction between cTnC and cTnI. Contact maps between cTnC (abscissa) and cTnI (ordinate) simulated for the PKC phosphomimetic (A) or the RCM mutant (B) were calculated from three independent production runs. In each panel, a differential map is constructed by subtracting the WT contact map and subsequently color-coded such that blue represents a decrease and red represents an increase in contact frequency. C summarizes contact frequencies between cTnI residue 145 and cTnC helix C Glu-56, Glu-59, and Glu-63 as indicated by the lightly shaded colored bars. PKC phosphomimetic significantly reduced contact between these residues, whereas the RCM R145W mutation virtually eliminated all contacts.
