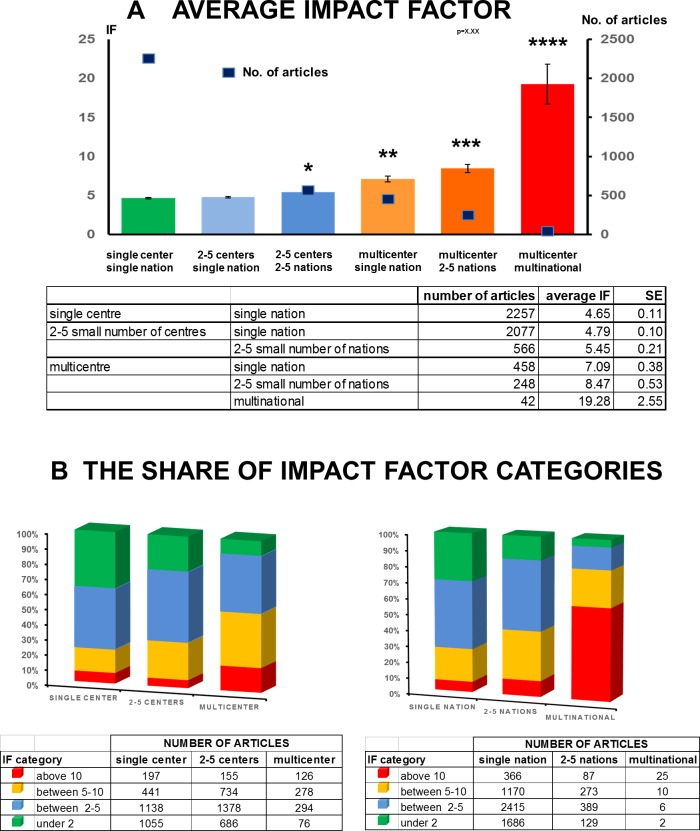
Fig 7.
A. Average impact factor by number of centres and nations. Both multicentre and multinational approaches increase the impact of the papers. *: p = 0.009 vs. single centre single nation; **: p˂0.001 vs single centre/single nation; ***: p˂0.001 vs 2–5 centres/2–5 nations and vs multicentre/single nation; ****: p˂0.001 vs all groups. Values are expressed as means ± standard error (S.E.M.) B. The share of average impact factor categories. There is a strong correlation between the number of countries per study and the quality of the article.

