Fig 2.
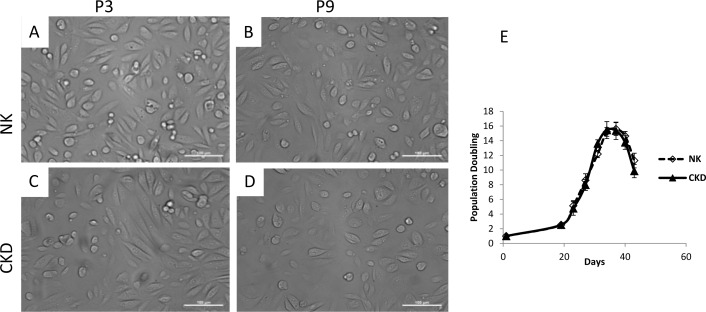
Photomicrograph of primary renal cell cultures derived from NK and CKD kidney at passage 3 (P3) and passage 9 (P9) (A-D). There were no differences in gross cell morphology between NK and CKD kidney cells at passages three (P3) and nine (P9). Original magnification x20; Cell growth curves of NK and CKD kidney derived primary renal cells. Cell growth curve of human NK and CKD cells (2E) from different age donors were counted after achieving confluency, had the same behavior in culture.

