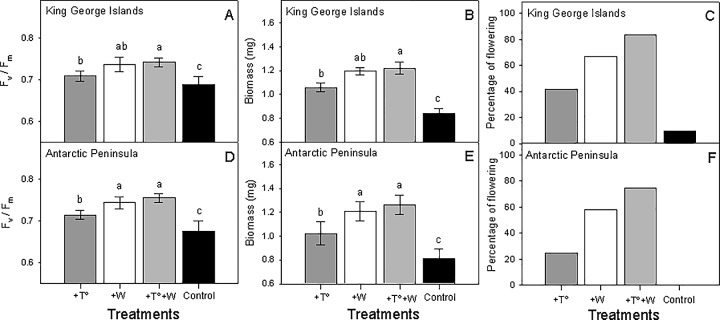
Fig 1. Results of global climate change simulation experiments.
Photochemical performance, measured as photochemical efficiency (Fv/Fm) of photosystem II (PSII), and total biomass and the percentage of flowering plants from King George Island (A, B, C) and Antarctic Peninsula (D, E, F) are shown. Plants from all origins were exposed to four experimental treatments (temperature increase, water availability increase, temperature plus water increase and control). Bars are means (± SD). Bars labeled with different lowercase letters are significantly different (Tukey HSD tests, α = 0.05).

