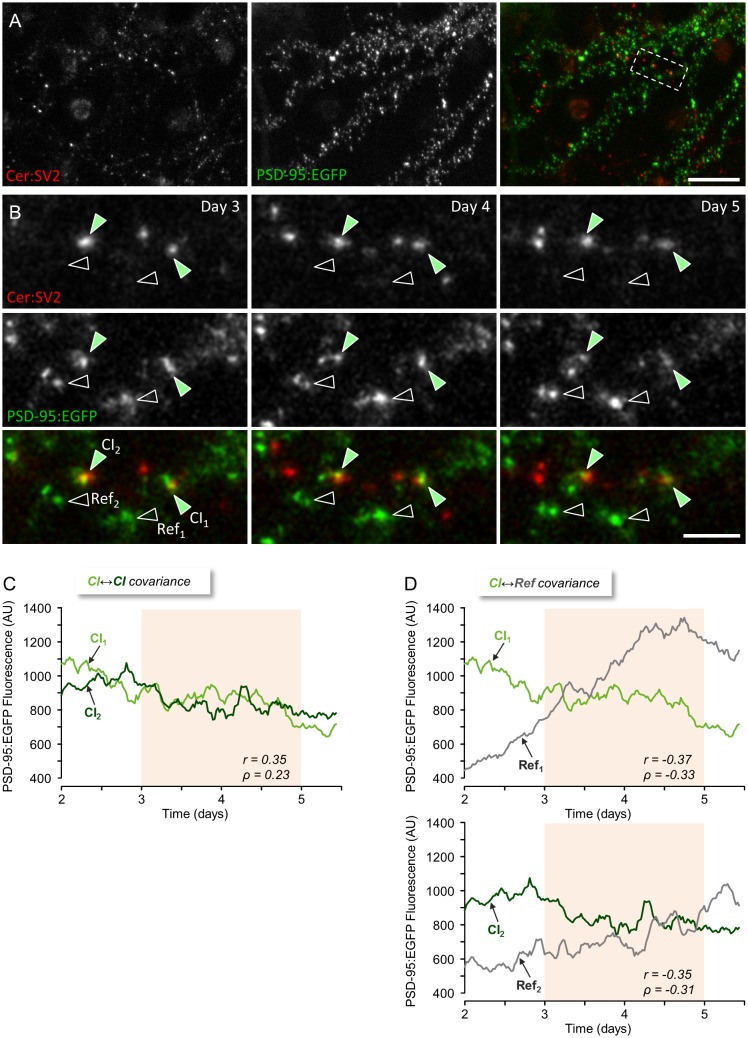
Fig 2. Comparing the size remodeling of CI and non-CI synapses.
(A) Cortical neurons growing on an MEA dish expressing cerulean-tagged SV2a (Cer:SV2, a presynaptic vesicle protein) and the postsynaptic scaffolding molecule PSD-95 tagged with EGFP (PSD-95:EGFP). (B) Enlarged view of region enclosed in stippled rectangle in (A) showing two CI synapses (green filled arrowheads) and two Ref synapses (empty arrowheads) at three time points obtained one day apart as part of week-long experiments in which PSD-95:EGFP images were collected at 30-min intervals. (C) Changes in PSD-95:EGFP fluorescence compared for the two CI synapses. (D) Similar comparisons made for each pair of a CI synapse and its respective Ref synapse over the same period. Pearson’s correlation (r) and Spearman’s rank correlation (ρ) coefficients measured for two-day periods (pink background) are shown for each comparison. Bars, 20 μm (A) and 5 μm (B). Source data provided in S1 Data.

